Getting Started
Project overview | Using the portal | REST API | Data organization | Data submission | Data analysis | Encyclopedia
Introduction to the Portal
Welcome to the ENCODE Portal! The ENCODE Portal, developed and maintained by the Data Coordination Center (ENCODE DCC), is the canonical source for all experimental metadata and data from ENCODE and associated projects. The ENCODE Portal contains raw and ground-level analysis data generated by participating mapping centers using a wide-range of assays (integrative analysis data are available at the SCREEN portal. The Portal also stores records of the materials and methods used to perform the assays and subsequent analysis. No account is needed to view or download released data.
Portal quick links
The ENCODE Portal contains the following types of data generated by the ENCODE Consortium:
- Data from a wide-range of assays, as well as protocol documents for each experiment
- Antibody characterizations that are performed as part of the antibody characterization process defined by the consortium
- Reference filesets used in the ENCODE uniform processing pipelines
Additional information about the activities of the ENCODE Consortium are provided on the Portal:
- Publications from consortium members
- Publications from community members using ENCODE data
- Citation guidelines for ENCODE data used in your publication
- Software tools that have been used by the ENCODE Consortium to process and analyze assays and predict functional regions
- Experimental guidelines and data standards for generating the data
- Outreach events, tutorials, and workshops that have been organized
Using the Portal
Browse for data | Visualize data | Download files
Browse and filter experiments
Clicking the “Search” option located in the “Data” toolbar menu located in the upper left corner brings up a list of all available experiments that have been used to generate ENCODE data. By default, search results are pre-filtered to experiments of status "released" (notice that in Figure 1, the facet term "released" is already highlighted). However, "archived" and "revoked" experiments are also publicly viewable. Explore the status terminology page for more information on what each status means.
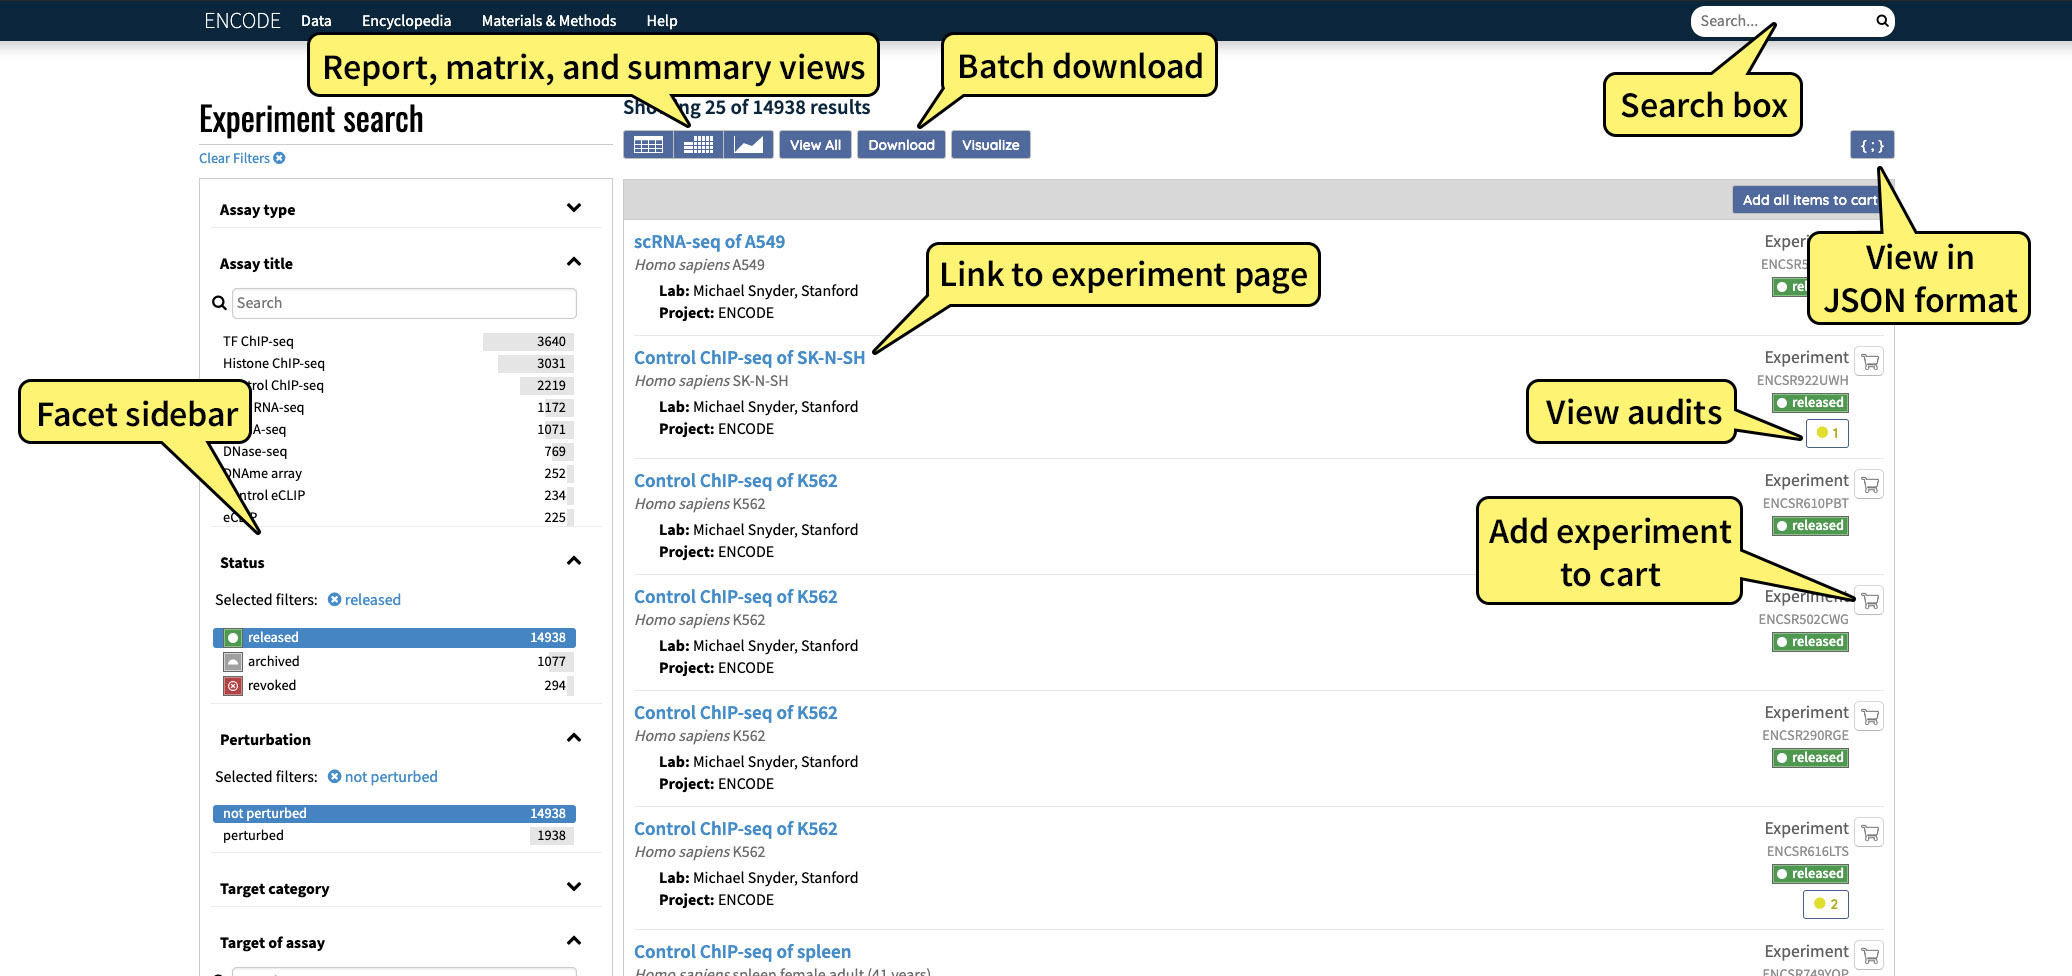
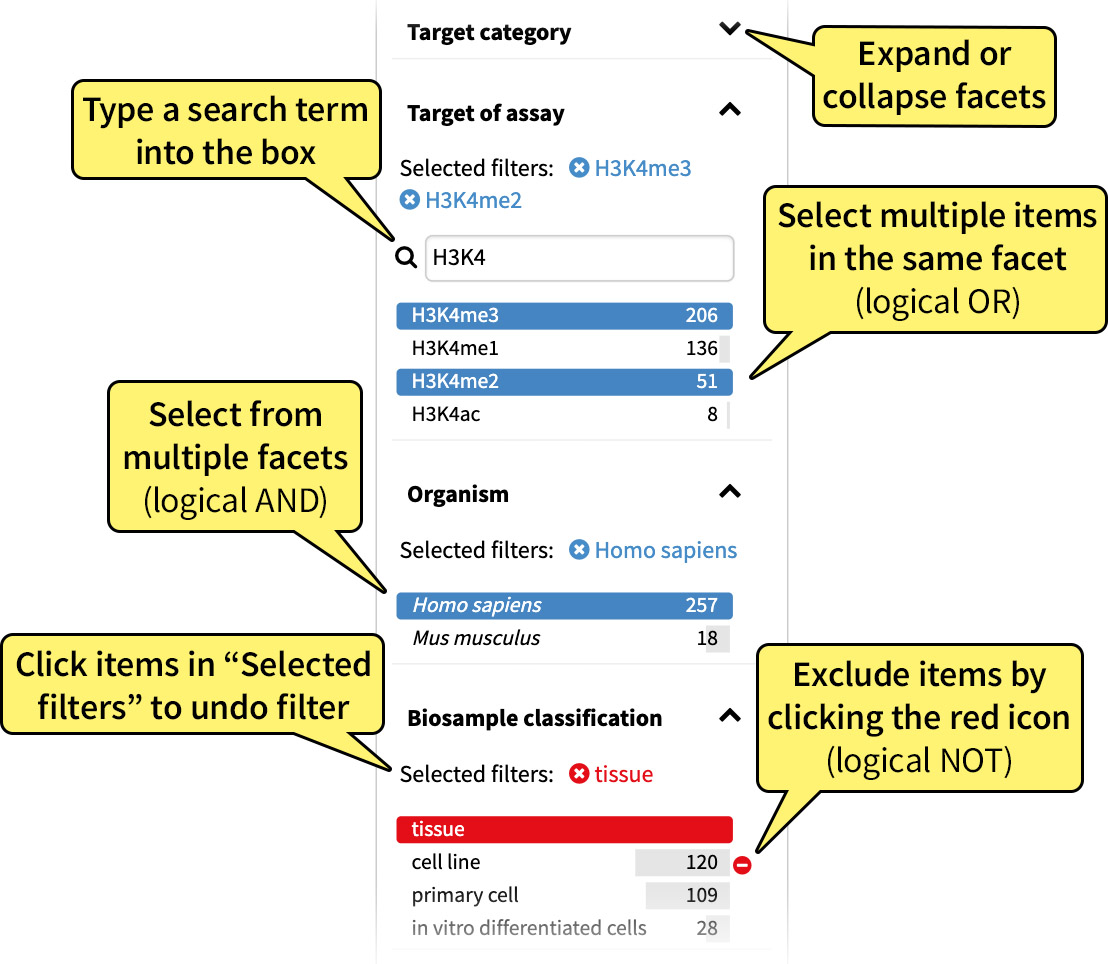
These results can be filtered by selecting one or more values in a metadata category, also referred to as a "facet," on the left hand side of the page. Multiple facet values, in the same or different categories, can be selected at any one time to generate more specific queries. To exclude a facet value, click the exclusion icon which appears to the right of each facet value when the cursor is hovered above it.
Users can also change the way search results are displayed depending on their needs. The Search page shows the results in List view by default, but clicking one of the three buttons along the top of the page will bring users to another view:
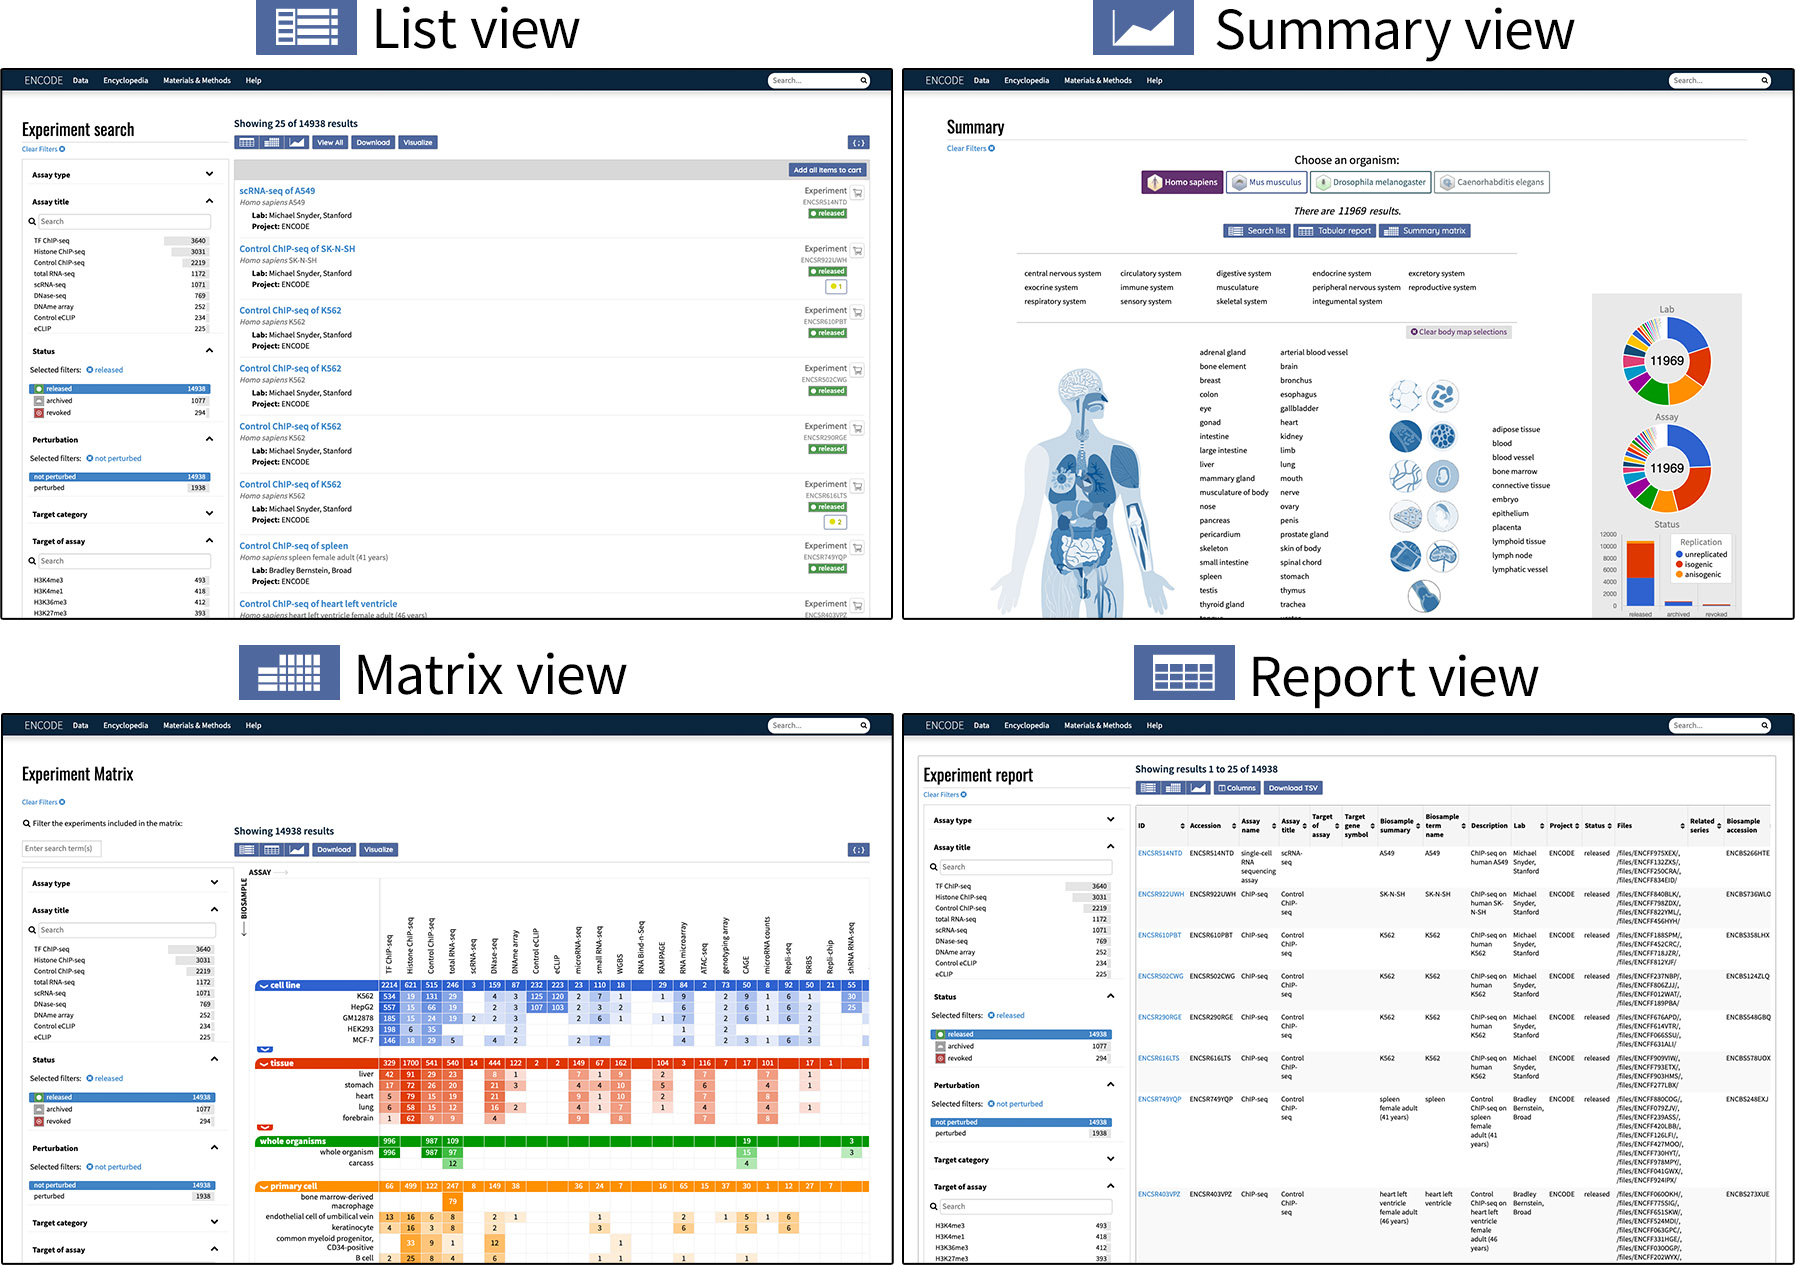
- List view: displays results in a list. Each experiment is labeled with a summary of assay and biosample used.
- Report view: displays results in tabular format, with a default selection of metadata properties as the columns.
-
Matrix view: displays results in a matrix, organized with biosamples along the y-axis and assay type along the x-axis.
- Summary view: displays a general overview of the data in chart form. A body map diagram is also available for human data.
Query building
Faceting is a user-friendly way to generate queries, which are URLs appended with specific parameters. With each selected facet, a parameter is added to your query based on the property and the desired value of that property. For example, in Figure 2, the selection of the H3K4me3 target adds target.label=H3K4me3 to your URL:
https://www.encodeproject.org/search/?type=Experiment&target.label=H3K4me3
Users can use any valid property of an object as a parameter, beyond those listed as facets. Generally, a query will be in the following format:
https://www.encodeproject.org/search/?type=Object_type&property_1=value_1&property_2=value_2&...
Below are some useful tips for query building:
- Wildcard (
*or%2A) is accepted as a valid property value. - Not equals (
!=or%21=) can be used for negation. - Multiple parameters are joined with an
&. - To access a sub-property, the sub-property name can be joined to the property name with a
., as intarget.label.
Object types and their properties are fully documented in the object schemas. It is also helpful to understand the ENCODE Portal's data model.
An example of an advanced query utilizing the above query building features is the below search, which filters for experiments (type=Experiment) that are released (status=released), not a control (target.label%21=Control), and are part of the ENTEx collaboration (internal_tags=ENTEx).
https://www.encodeproject.org/search/?type=Experiment&status=released&target.label%21=Control&internal_tags=ENTEx
More information and interactive examples of query building can be found on Swagger.
Search by keyword
The website can be searched by entering a search term in the search box located in the upper right hand corner in the toolbar (see Figure 1), which appears on every page. This returns relevant results of any object type (such as Experiments, Antibodies, Publications, or others). Due to the number of objects stored on the Portal, only a subset of key properties, which are documented in the Schemas for each object type, are searchable with this method.
The search results can be narrowed by object type by selecting an item in the "Data Type" facet on the left hand side of the page, and then further filtered using the displayed facets (refer to the "Browse and filter data" section above).
Example search terms include a biosample (e.g."skin"), an assay name (e.g. "ChIP-seq"), or a protein target of an antibody (e.g. "CTCF").
Viewing experiment pages
After searching for experiments, clicking on a link to a specific experiment will bring you to the experiment summary page:
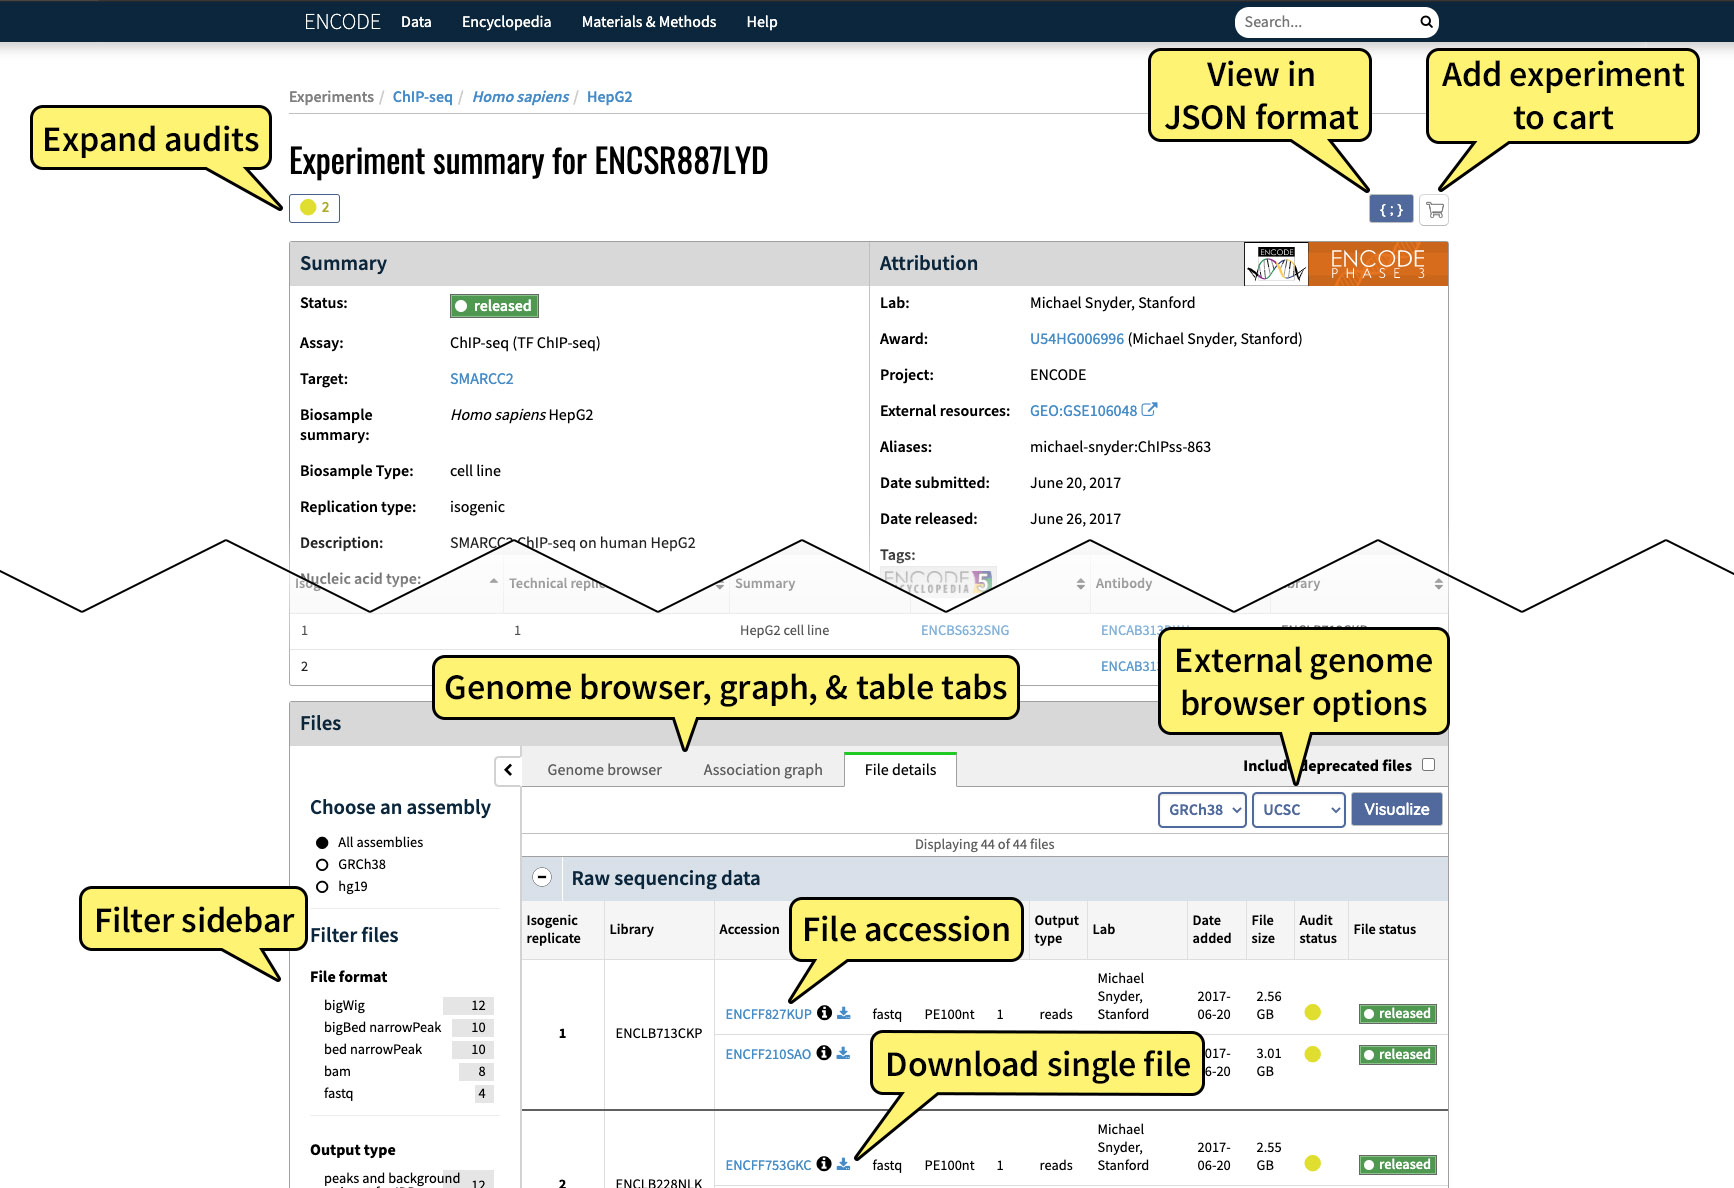
The experiment summary page displays metadata about the experiment in question and the raw and processed data from the experiment, as well as protocols, materials used, audits, the lab that conducted the experiment, and other useful information.
Visualize data
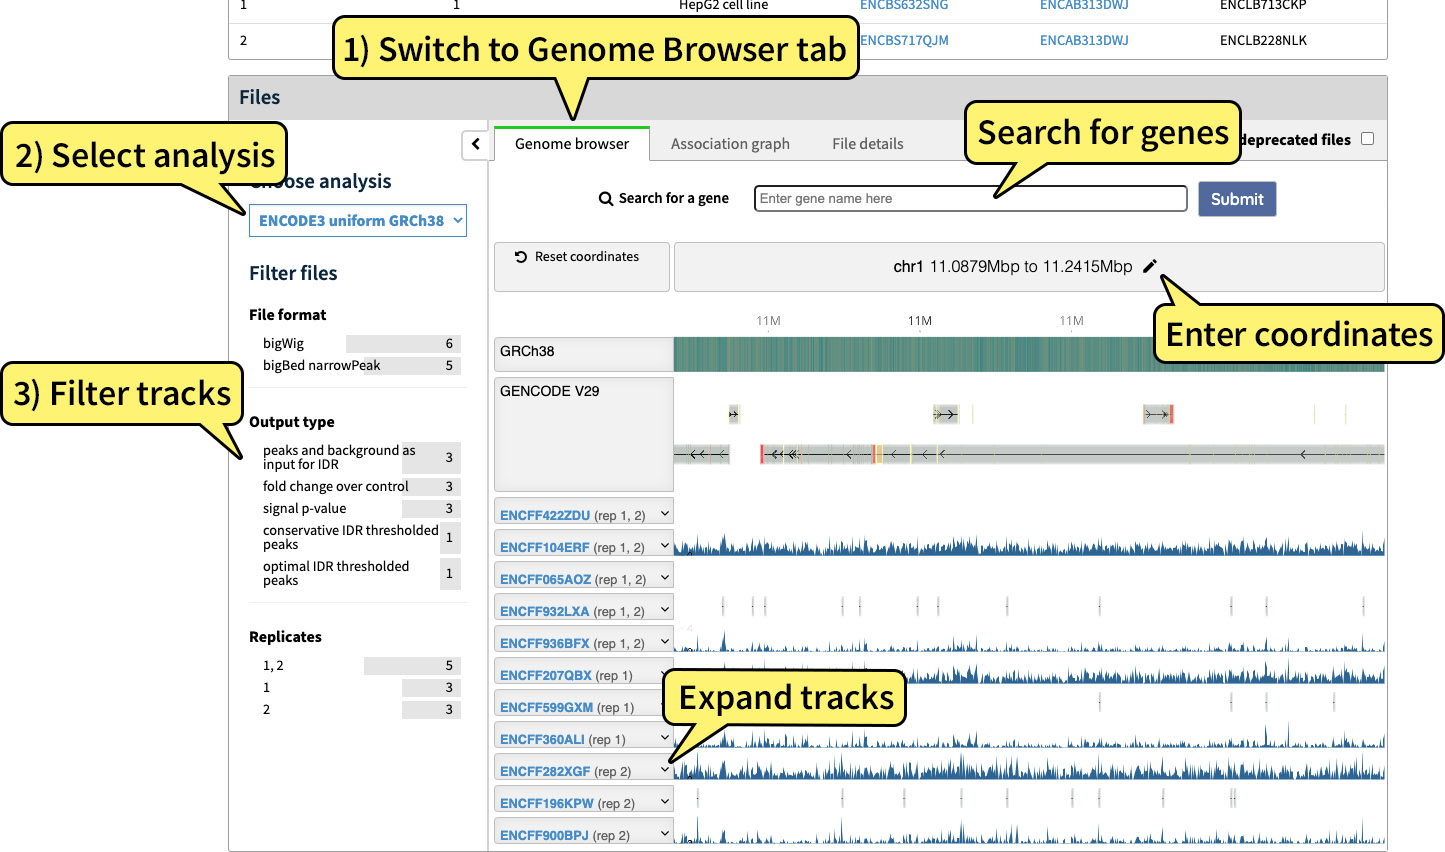
Results in bigBed or bigWig file format can be directly exported to and displayed on a genome browser. To visualize a single experiment, navigate to the experiment's page and click the "Genome browser" tab of the Files section to view tracks with the embedded Valis genome browser.
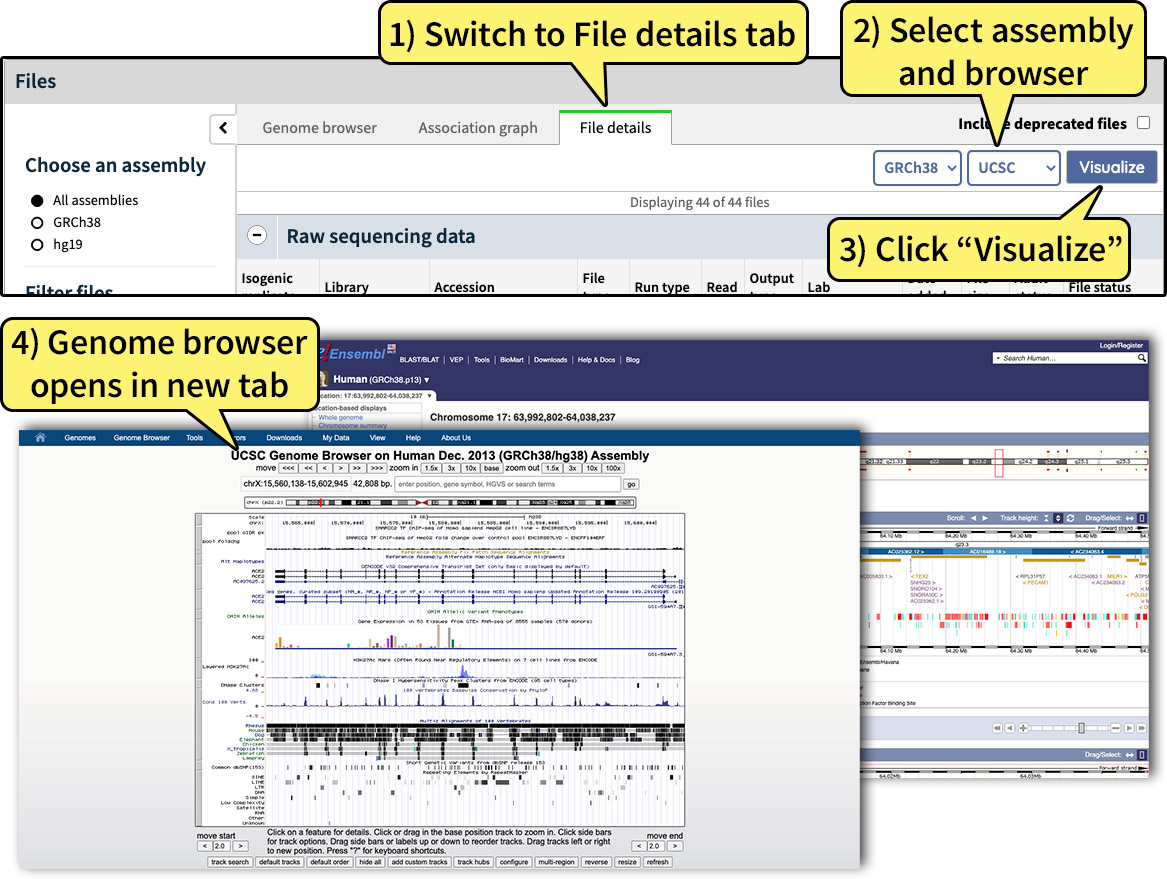
Alternatively, switch to the Files details tab (see Fig. 6) to launch an external genome browser.
To change the assembly, use the assembly selector in the upper right corner of the File details tab. Towards the right, there is also a browser selector, which will allow you to choose between UCSC, Ensembl, or Juicebox genome browsers. Files must be in bigBed or bigWig file format to be visualized as a track hub, or hic format to be visualized using Juicebox. Click the "Visualize" button to open the external genome browser.
The "Visualize" button also appears on Search and Matrix view pages (see Fig. 1) once filtered to a maximum of 100 experiments, provided there are released experiments with visualizable files within that set. By clicking "Visualize" from a search page, you can open a genome browser view with track hubs for each experiment in the search results, allowing you to visualize data from multiple experiments simultaneously.
Download files
Links to download individual files are available beside each file accession listed in the file section of each experiment page (see above in Fig. 4), as well as on each file's individual page. Files can be downloaded directly from the web page. Alternatively, the link can be copied to be downloaded using the command line, as in the below examples:
Via the wget command:
> wget https://www.encodeproject.org/files/ENCFF002CTW/@@download/ENCFF002CTW.bed.gz
Or via the curl command:
> curl -O -L https://www.encodeproject.org/files/ENCFF002CTW/@@download/ENCFF002CTW.bed.gz
There are multiple options for downloading more than one file. While browsing through experiments (see "Browse and filter data"), a "Download" button appears near the top of the page (see Fig. 2), which brings up a batch download pop-up window with instructions on how to download the files of all experiments found with the current query. The cart feature, described below, can also be helpful.
Please note that if ENCODE data is used in your publication or talk, the accessions of the datasets used should be cited, along with the most recent ENCODE Consortium publication. Complete guidelines are available on the Citing ENCODE page.
Cart
The Portal has a cart function, which allows users to select and group together arbitrary experiments. Carts can be shared with colleagues; it is also possible to batch download all the files of the experiments placed in the cart. When viewing the cart, the file selectors located in the sidebar can be used to filter for only files meeting certain conditions, such as assembly used or file format, prior to performing a batch download. Detailed information on how to use the cart is located on the Cart page.
Programmatic access to the Portal
In addition to web-based browsing and searching, the ENCODE Portal can be accessed programmatically via the REST API. Instructions on how to browse and search for ENCODE data programmatically are provided in the REST API help document. In brief, all queries (see Query building) that can be performed via the web can be used as programmatic queries. Programmatic access provides additional methods to download files by retrieving direct URLs of files from JSON data objects.
RNA-Get (gene expression)
The Portal has a new feature that now allows users to look up gene expression values for genes across different datasets. For more information click here.