How to run the ENCODE ChIP-seq pipeline on DNA Nexus
1. Sign in to dnanexus.com
For information on making a DNA Nexus account, visit our page on account creation.
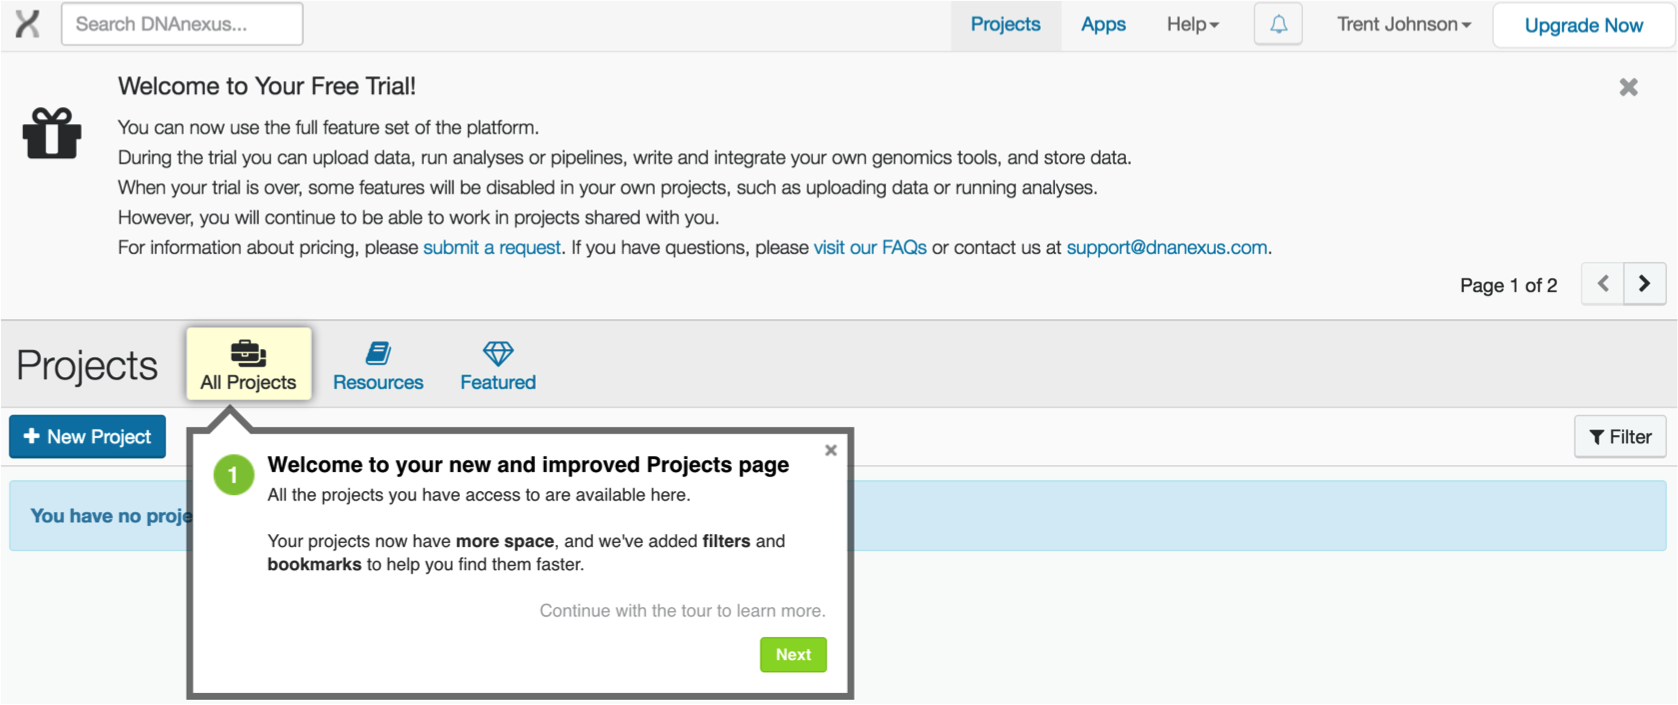
Click on "New project" on your Projects page.
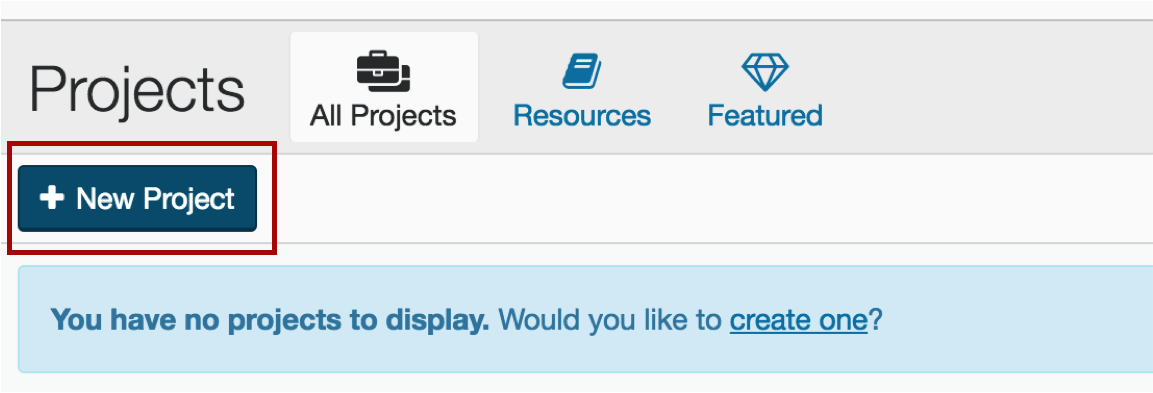
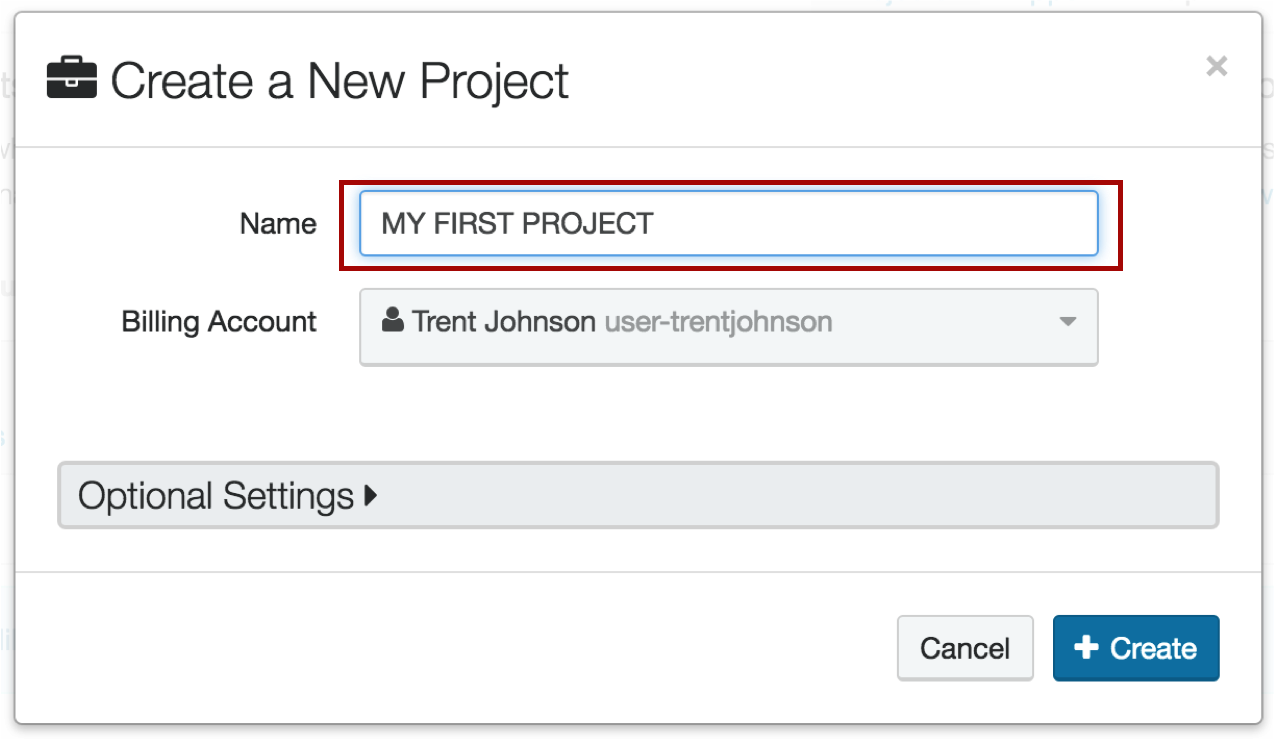
2. Create your project
Be sure to give it a name that makes sense. E.g. if you are running ChIP-seq mouse experiments on mm10, you might name it "ChIP-seq mm10 runs"
3. Add data to your project
Click the Add Data button...
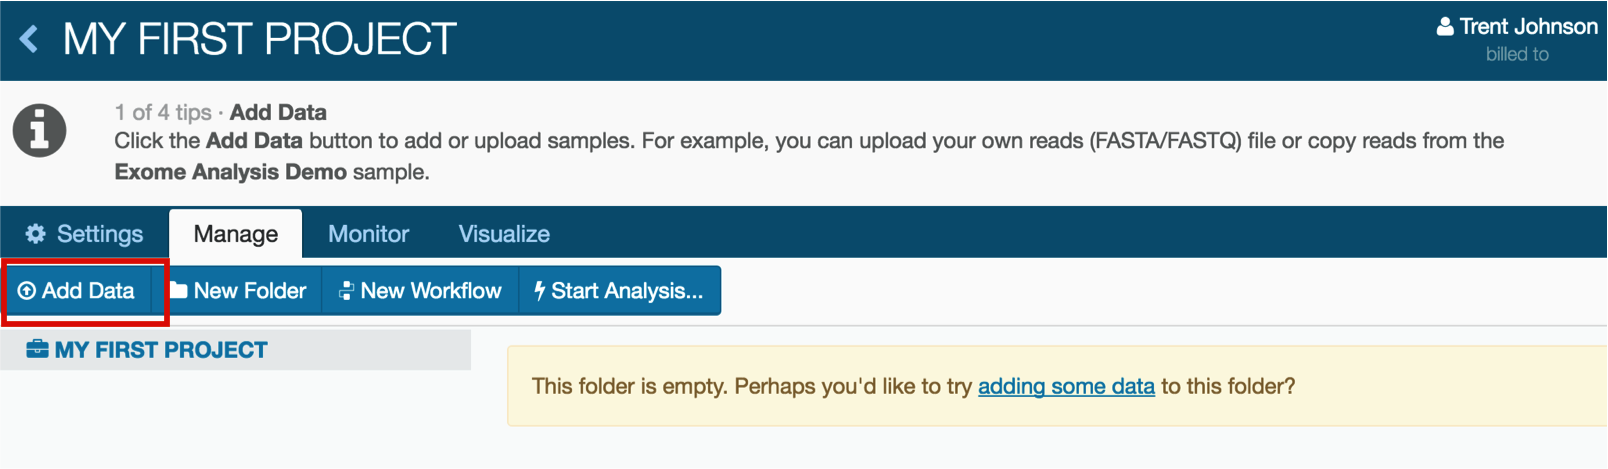
...and choose "From another project". There will be a window that allows you to choose the project from which you would like to import the data.
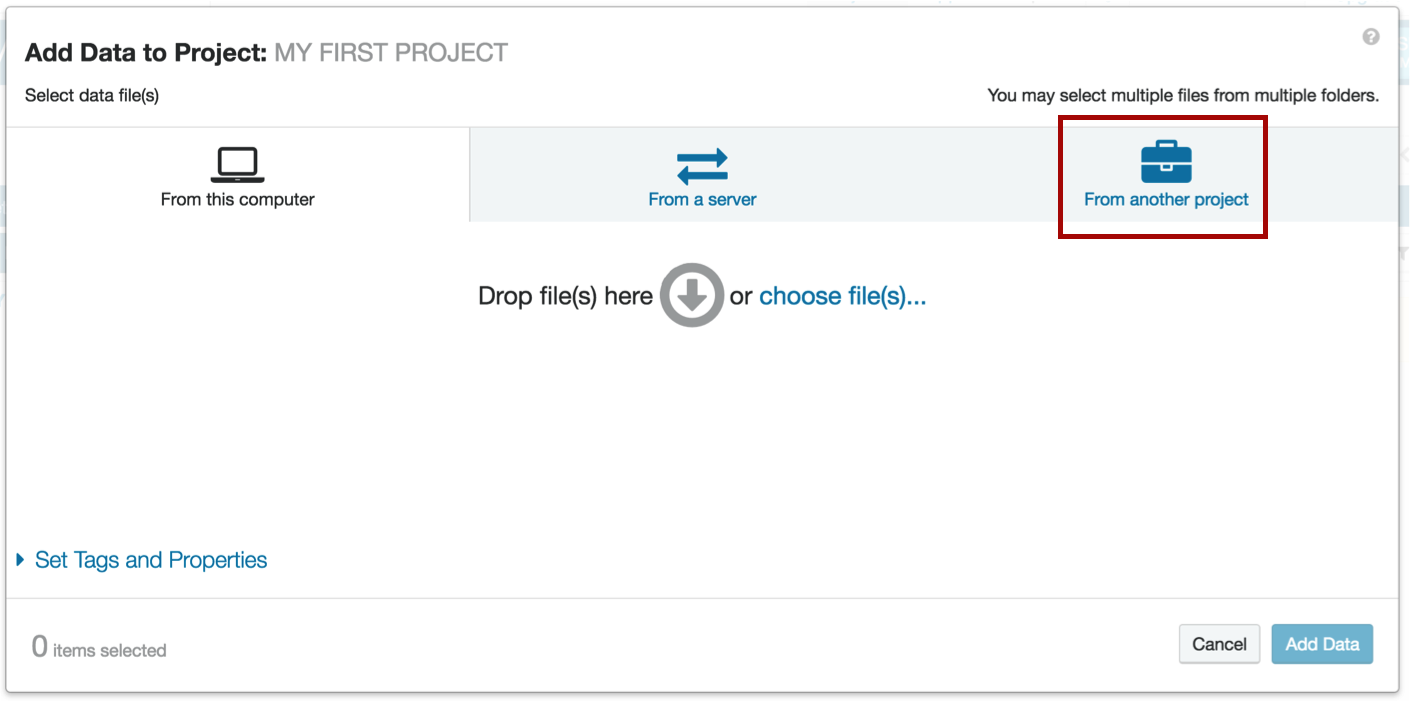
When you run your own analysis, you can also upload your own data directly from your computer or enter the url of a file hosted on a server. Our example will use data that is already uploaded to DNA Nexus.
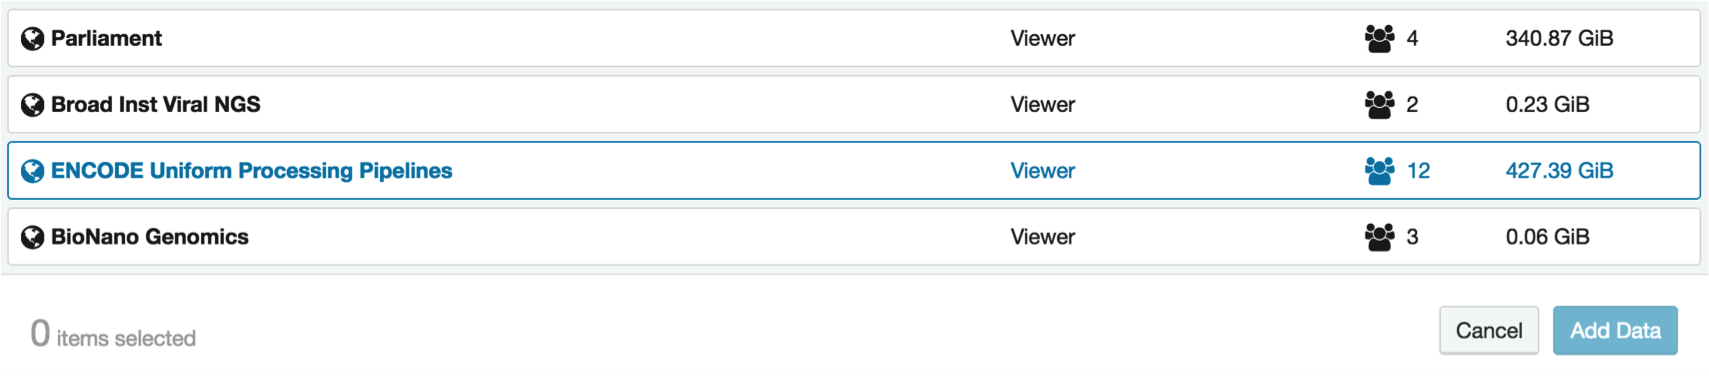
4. Import data from the ENCODE Uniform Processing Pipelines project
The ENCODE Uniform Processing Pipelines are a public project on DNA Nexus. Anyone may use them to analyze their own data, but we will be relying on sample data today.
Within the project, select the ChIP-seq folder and click the Add Data button
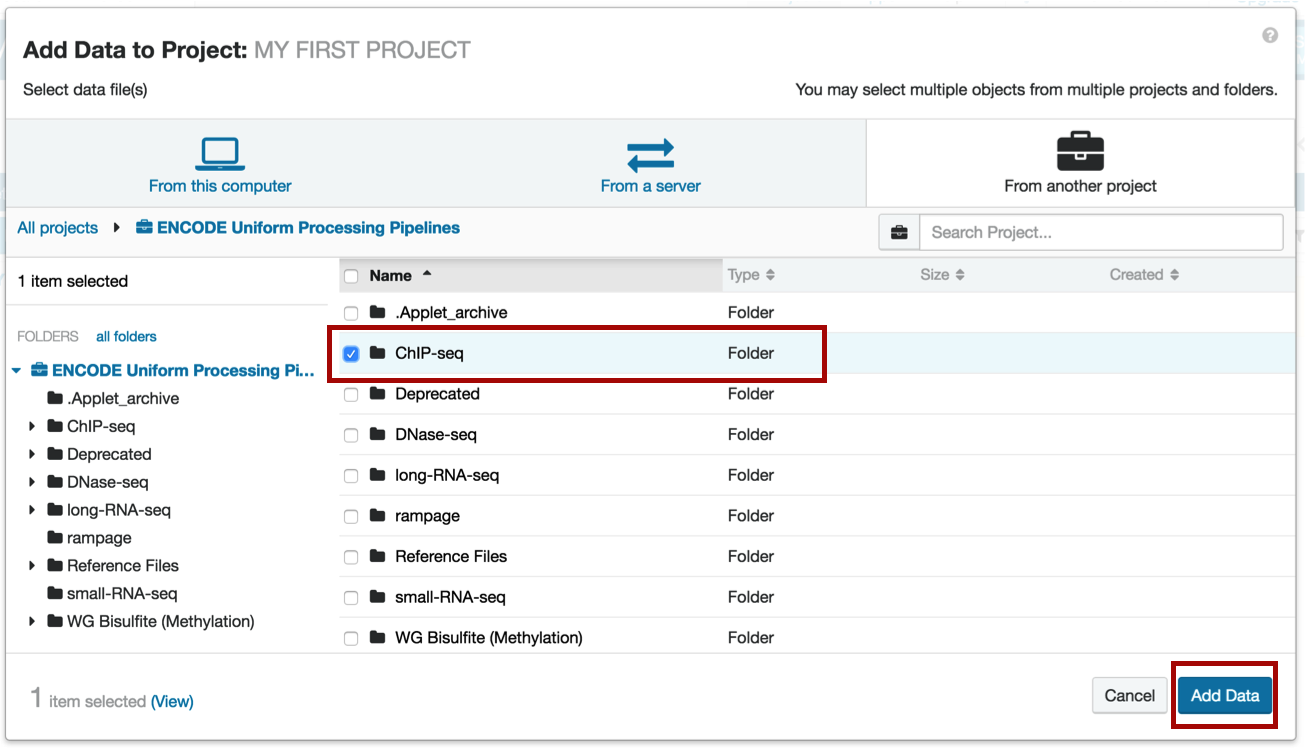
You will see a pop-up window with the status of the data transfer. Once it's complete, click the Close button.
![]()
5. Choose the workflow
Within your project, click on the ChIP-seq folder to view the subfolders.
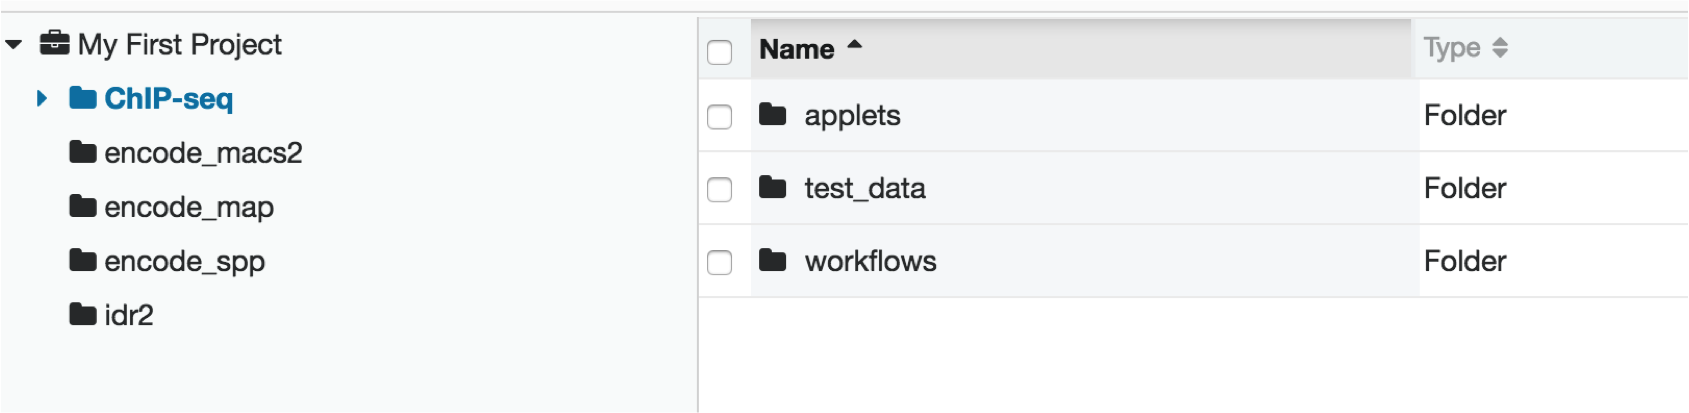
The applet folder contains the software used for alignment, peak calling, and data quality metric calculations.
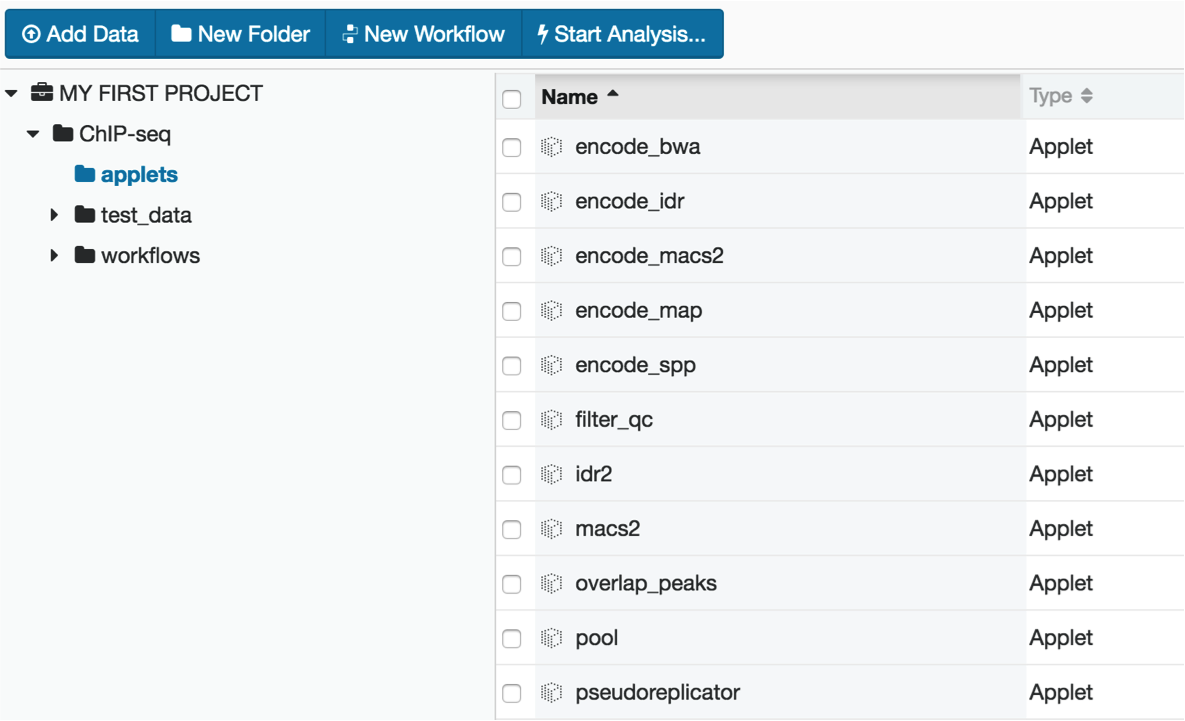
The workflow folder contains the full pipeline in an easy-to-use interface. In this example, we will be using the hg19 assembly to process data.
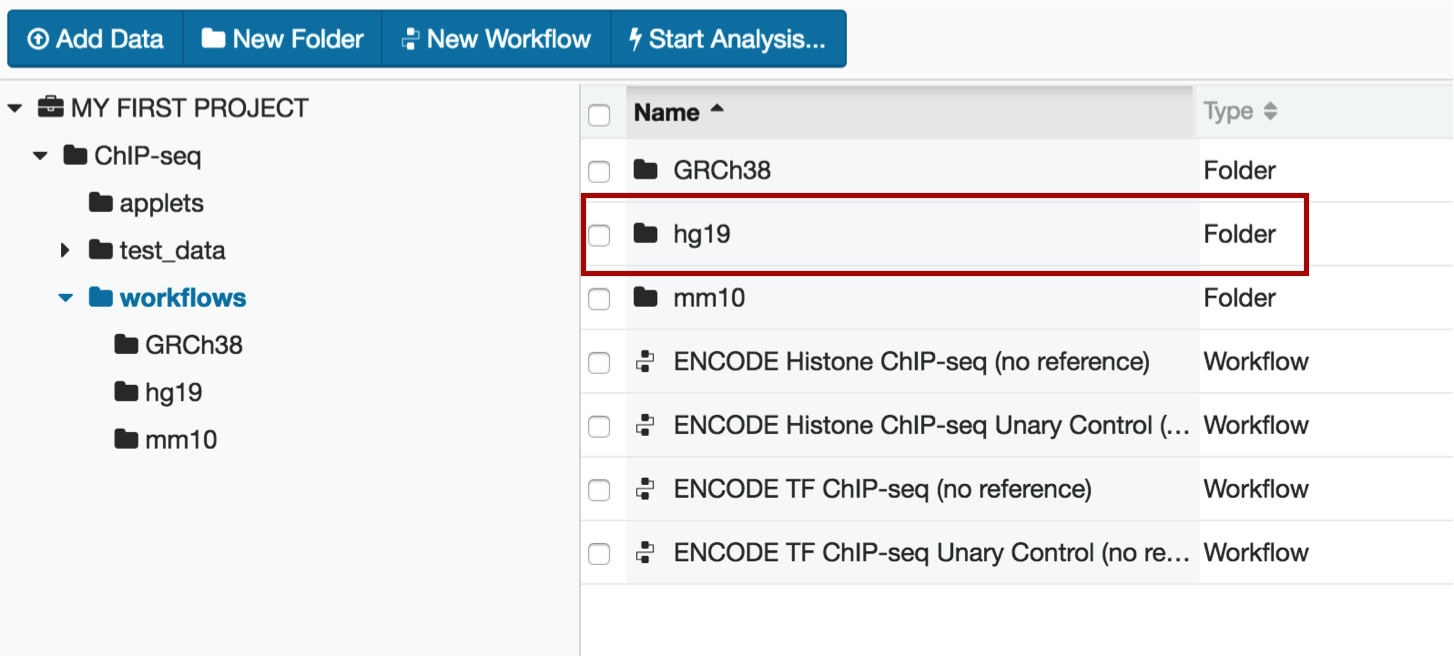
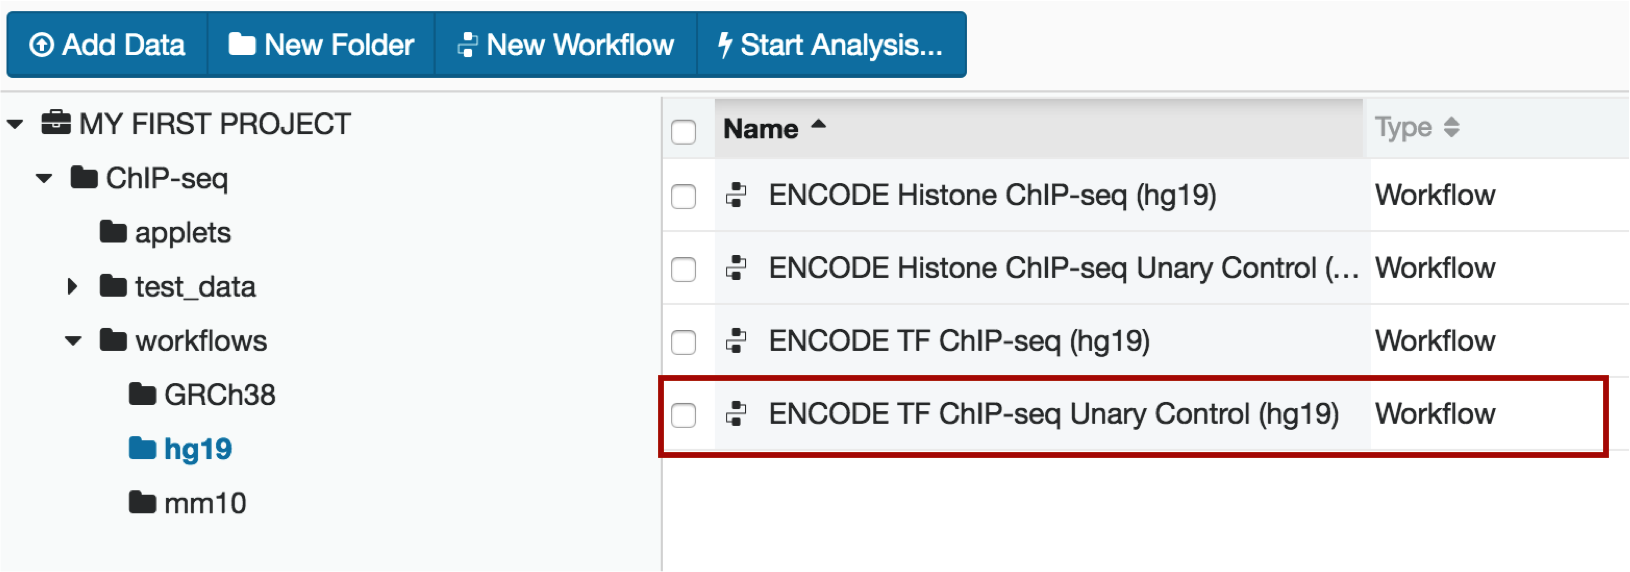
Within the hg19 folder, select the TF Unary Control workflow
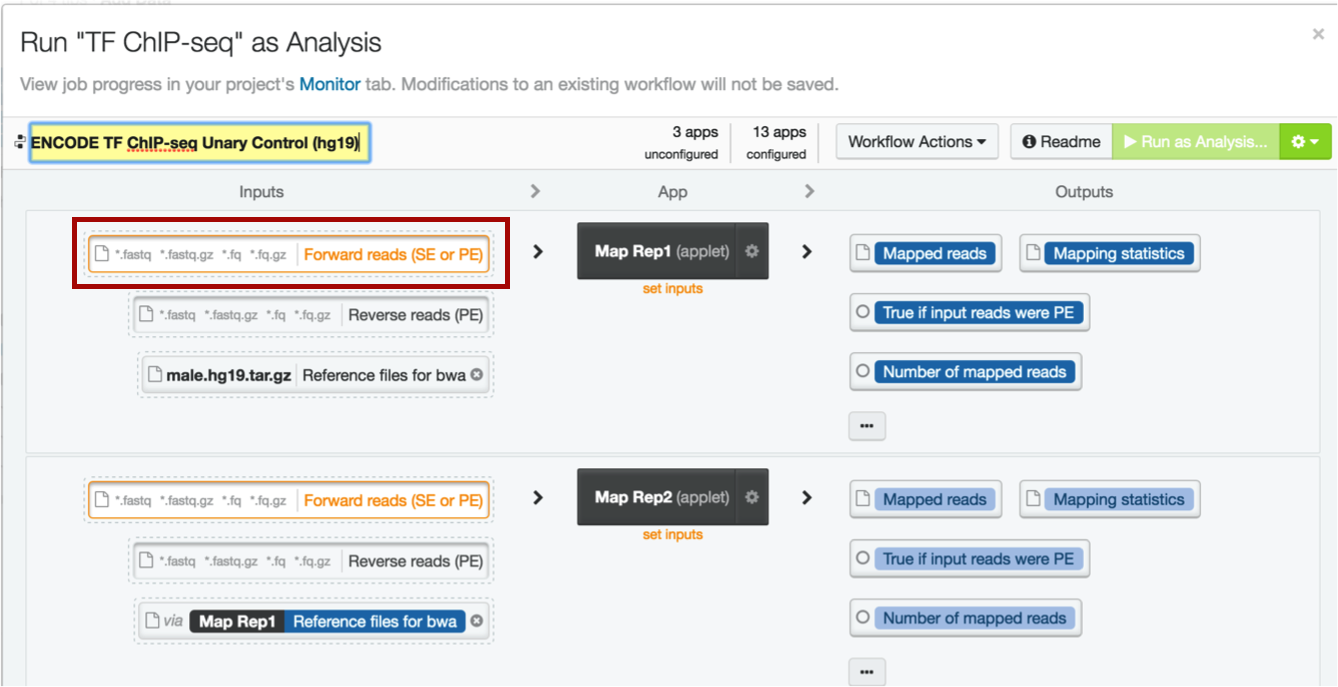
6. Loading your experimental data into the pipeline
The DNA Nexus interface is easy to use regardless of programming level or bioinformatics experience. Simply load your fastqs into the appropriate boxes, making sure that any paired-ended data is in the correct forward or reverse box (this example is single-ended data).
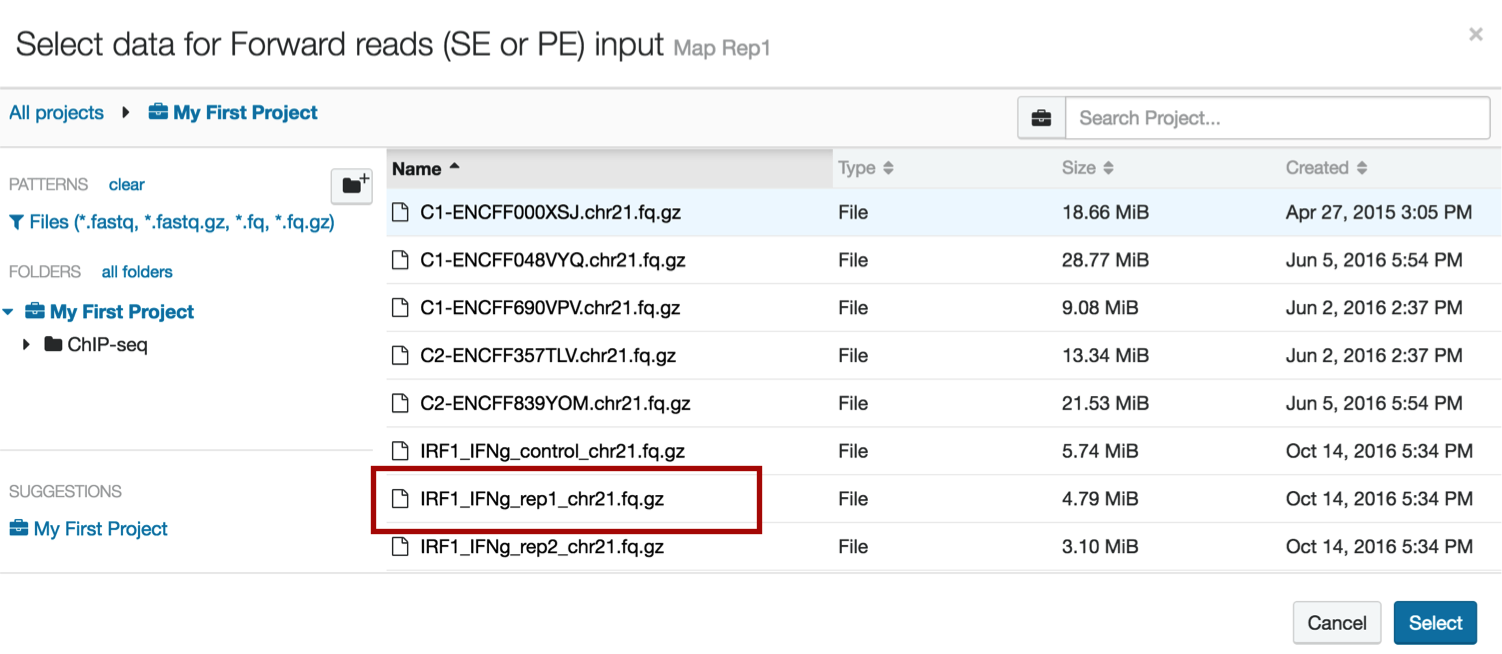
Select the data to load by clicking on the appropriate box
Choose the file to upload. Note that this file contains "rep1" in the name; when you run your analyses, make sure you insert forward and reverse reads correctly if doing paired-ended sequencing, and that the correct files are inserted into the correct replicates. This will make tracking easier.
Repeat this process for replicate 2.
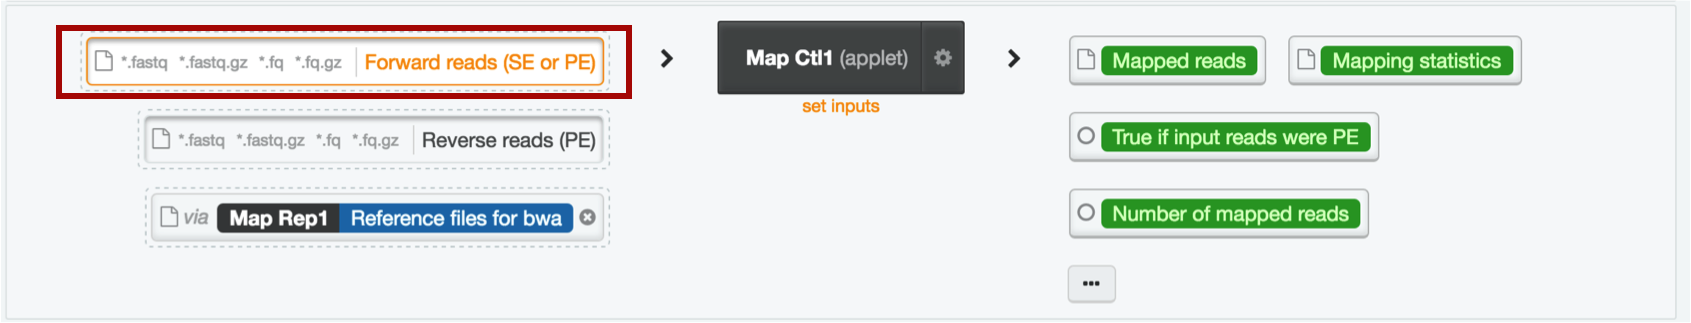
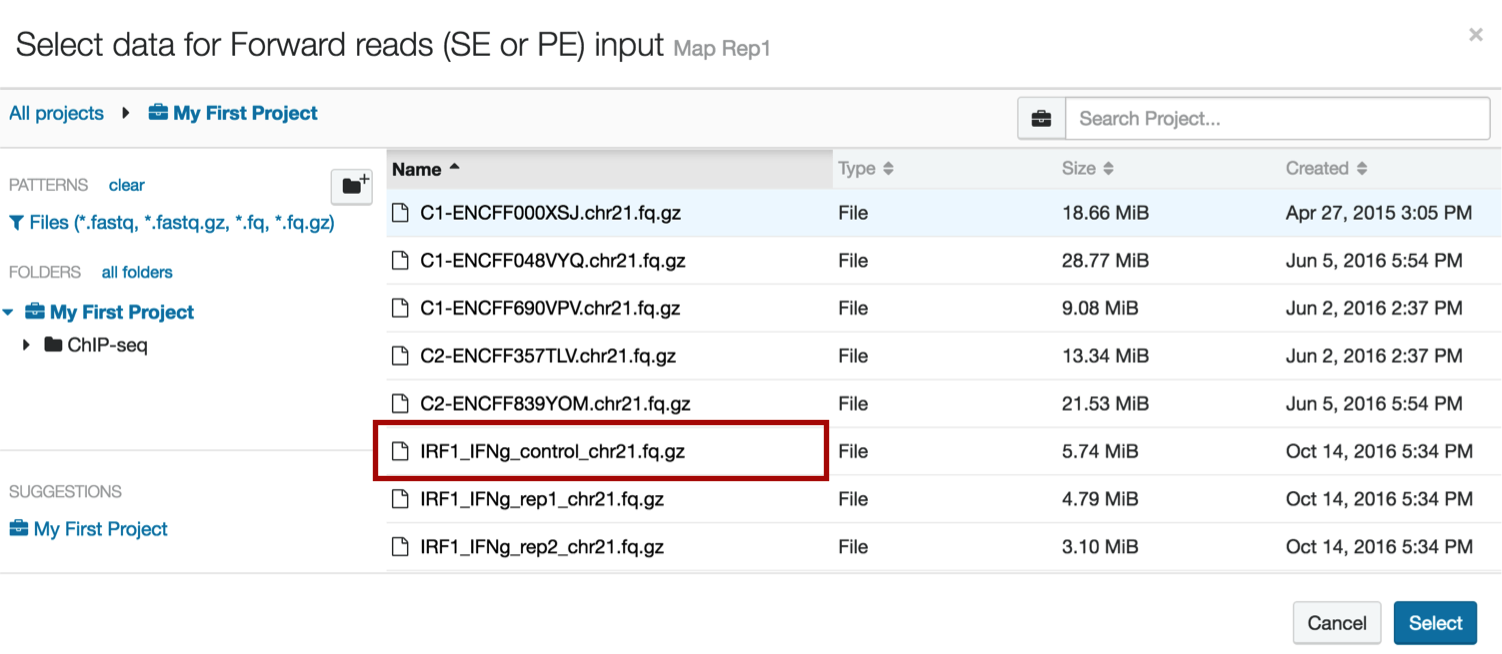
7. Loading your control data
Repeat step 6 to load your control data into the Map Ctl1 step.
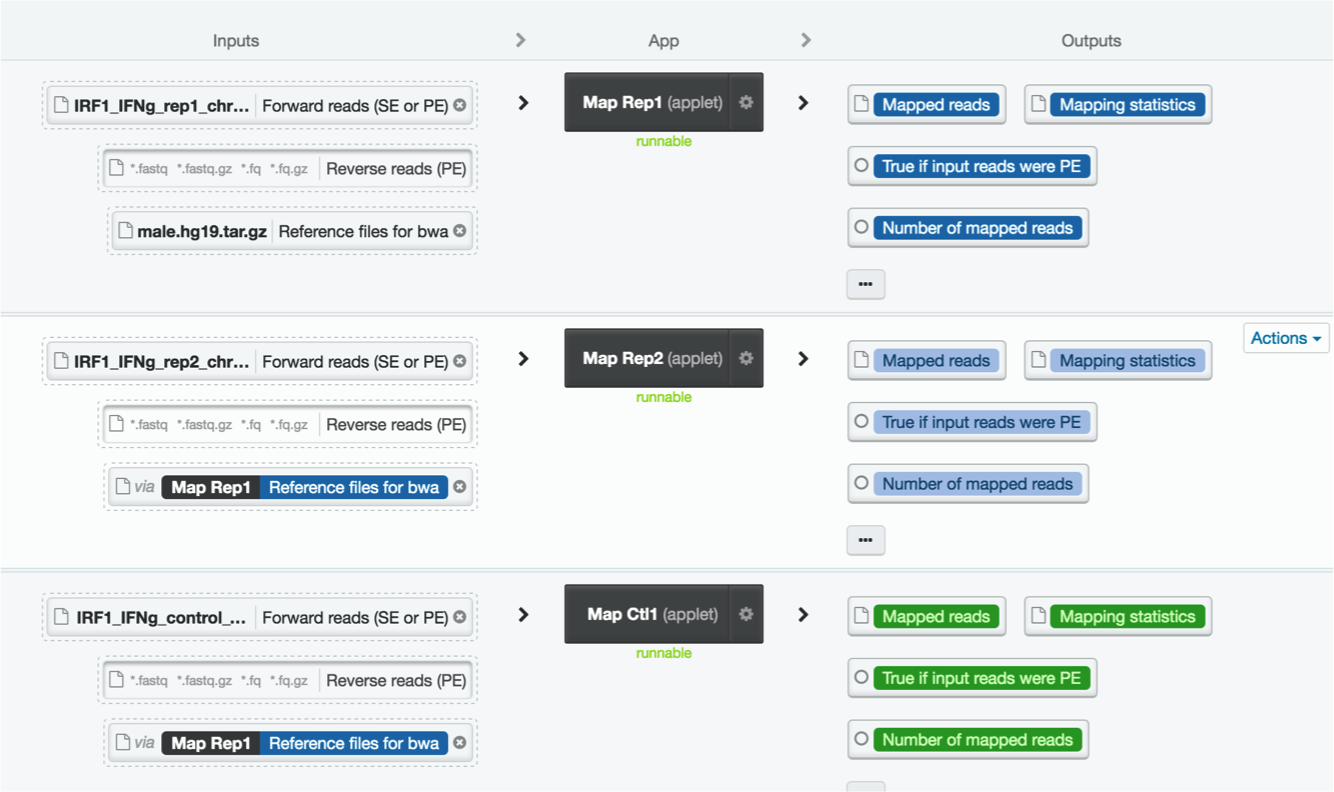
Your workflow should now look like this:
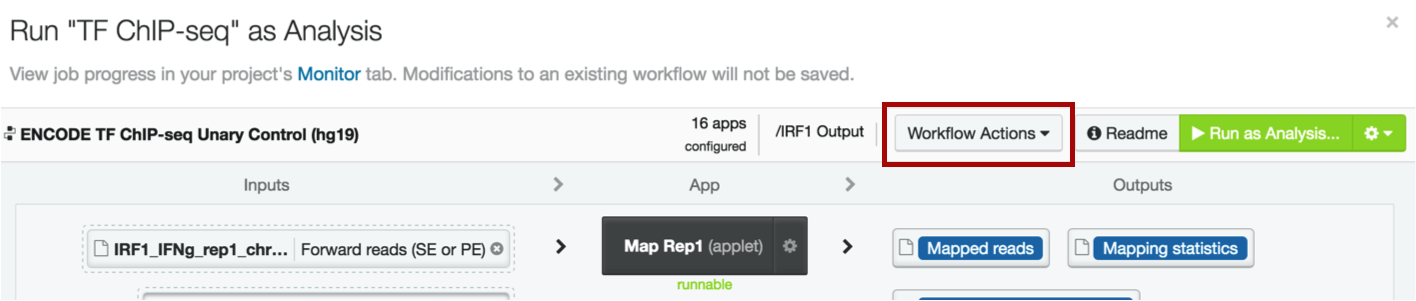
8. Running your analysis
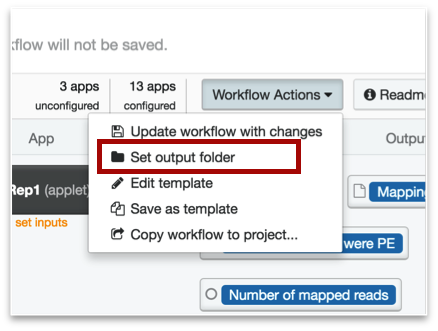
Click on the Workflow Actions menu on the top right of your workflow page and select "Set output folder".
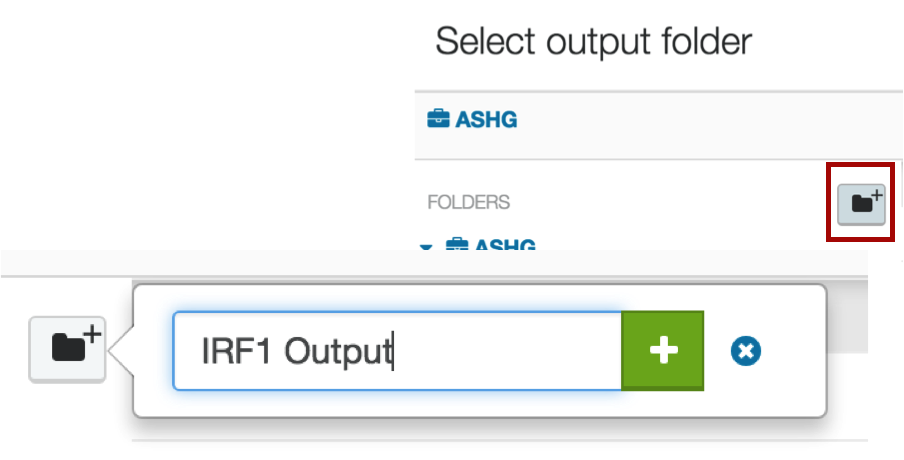
You will be directed back to your project, where you can either choose one of the existing folders, or create a new one. We suggest creating a new one by clicking the icon of the folder with a plus sign next to it. Give the file a name that makes sense to you, e.g. "ChIP-seq output hg19", or "IRF1 output".
You are now completely set up to process your data. Click the bright green Run as Analysis button in the top right corner of your workflow.
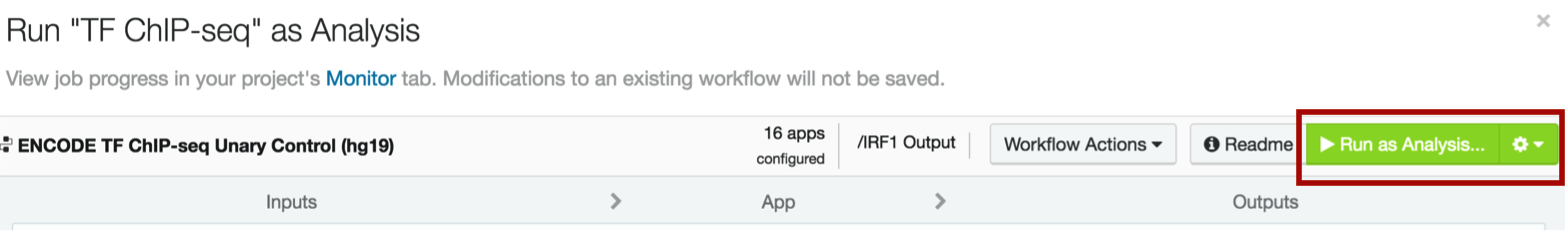
The pipeline should take about 45 minutes to run.
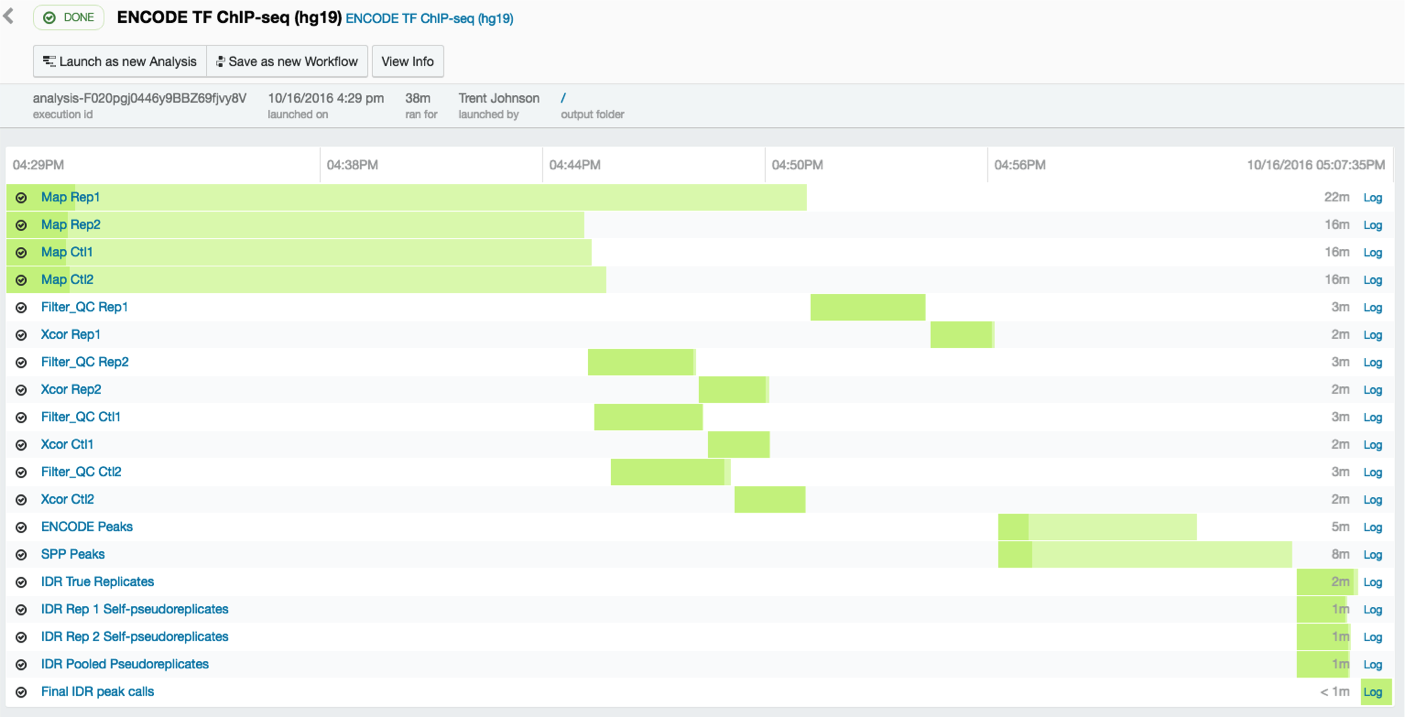
9. Monitoring and viewing your analyses
DNA Nexus has a general "Monitor" tab that allows you to view the progress of your analysis.
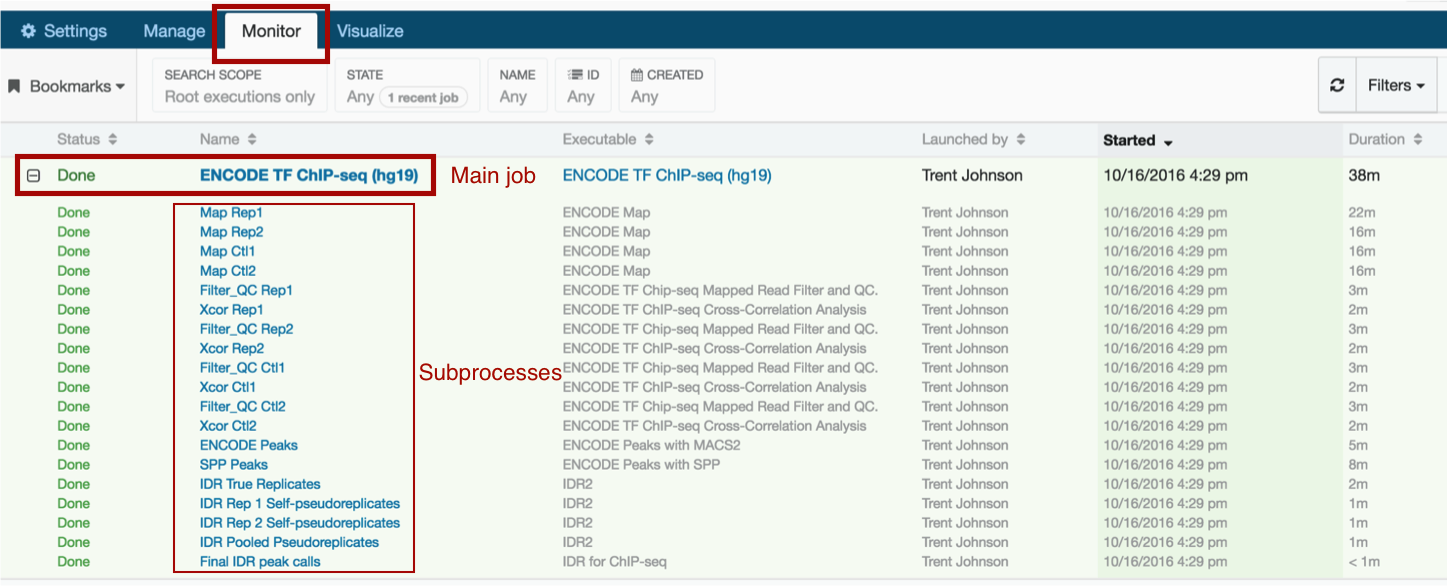
To view more detailed progress, click on the job in question. You can monitor exactly which subprocesses are still running and which have completed; the details of any errors will also be listed here. Note that the ENCODE Uniform Processing pipelines calculate several quality metrics including read depth, library complexity, bottlenecking levels, and replicate concordance. For more on the definitions of various quality metrics, visit https://www.encodeproject.org/data-standards/.
10. Downloading your data in preparation for visualization
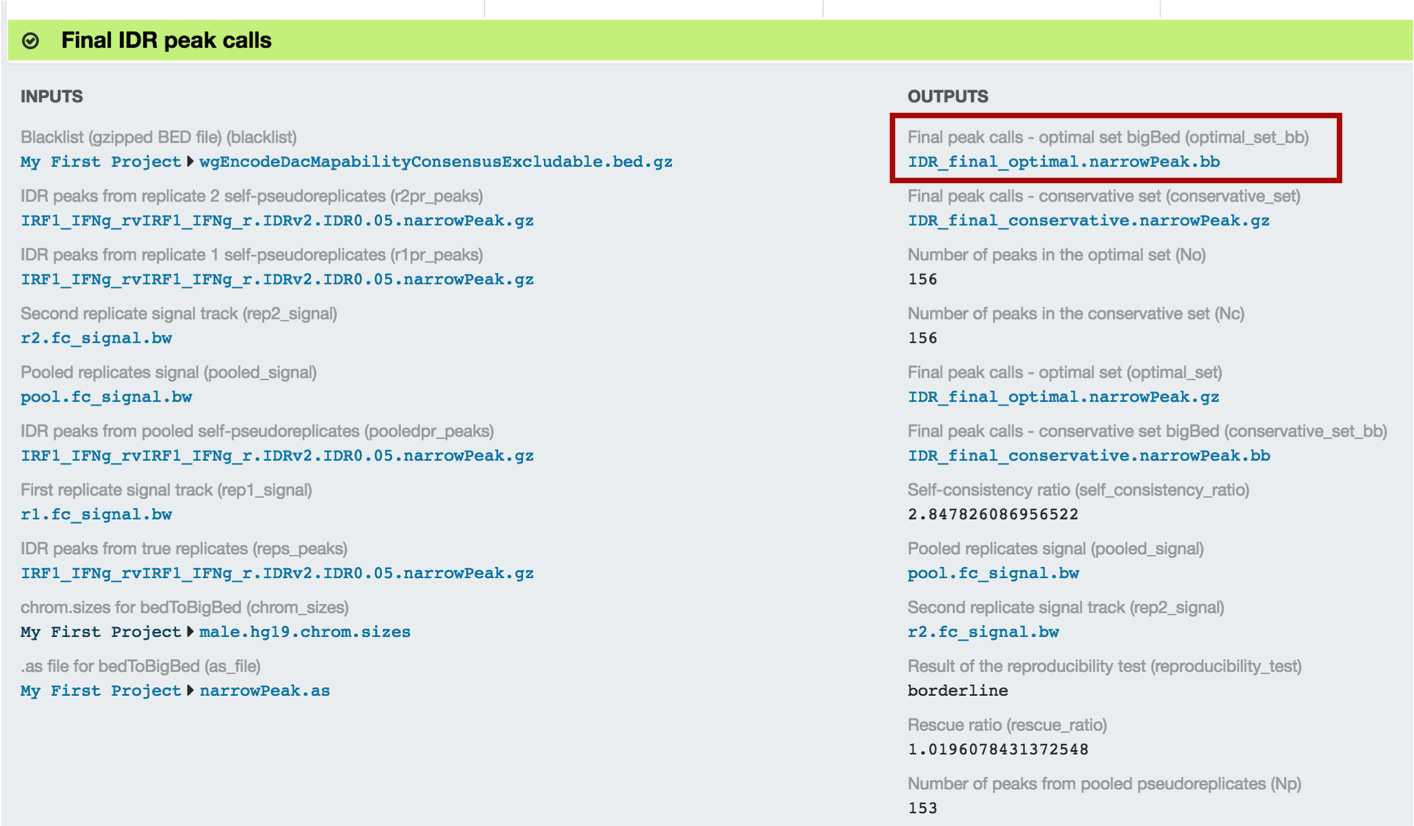
Once the pipeline has finished, click on the the final IDR peak calling step at the bottom of your monitoring page.

Look for the optimal IDR thresholded peaks and note the file name...
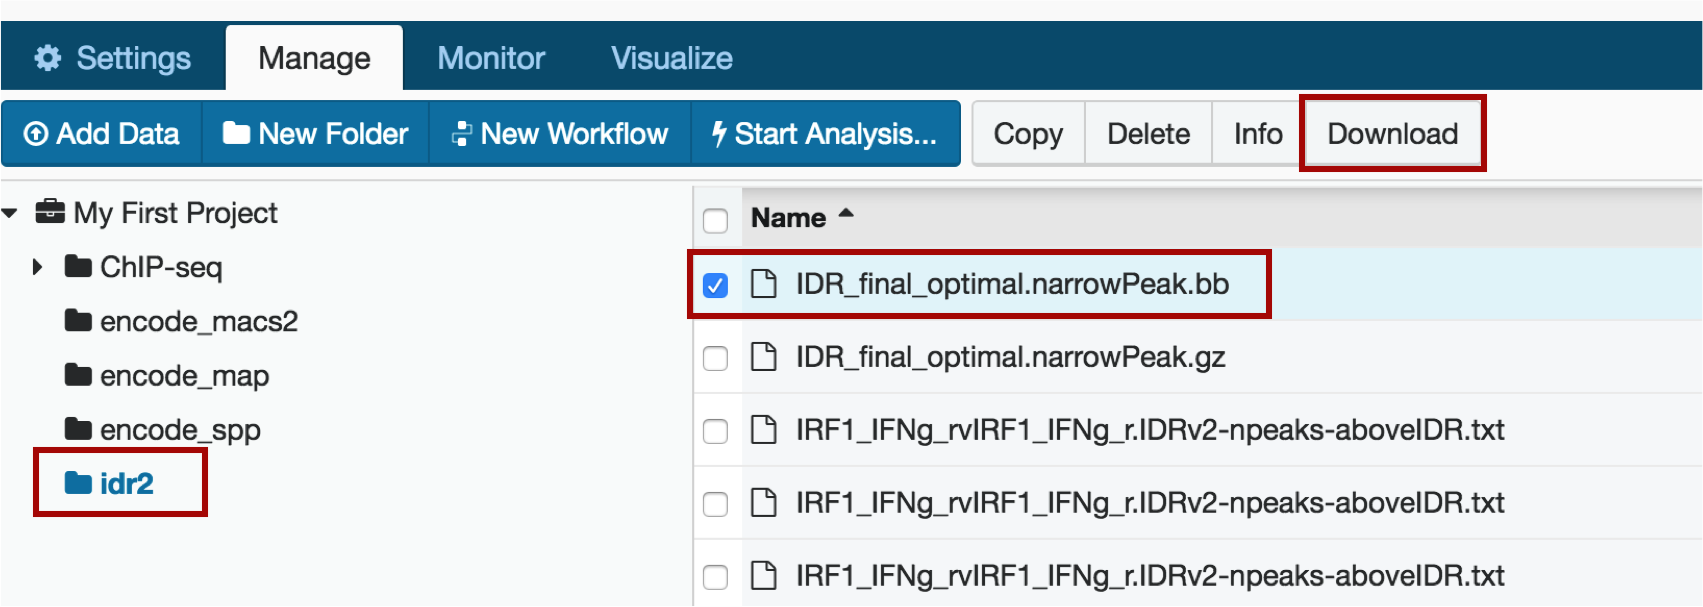
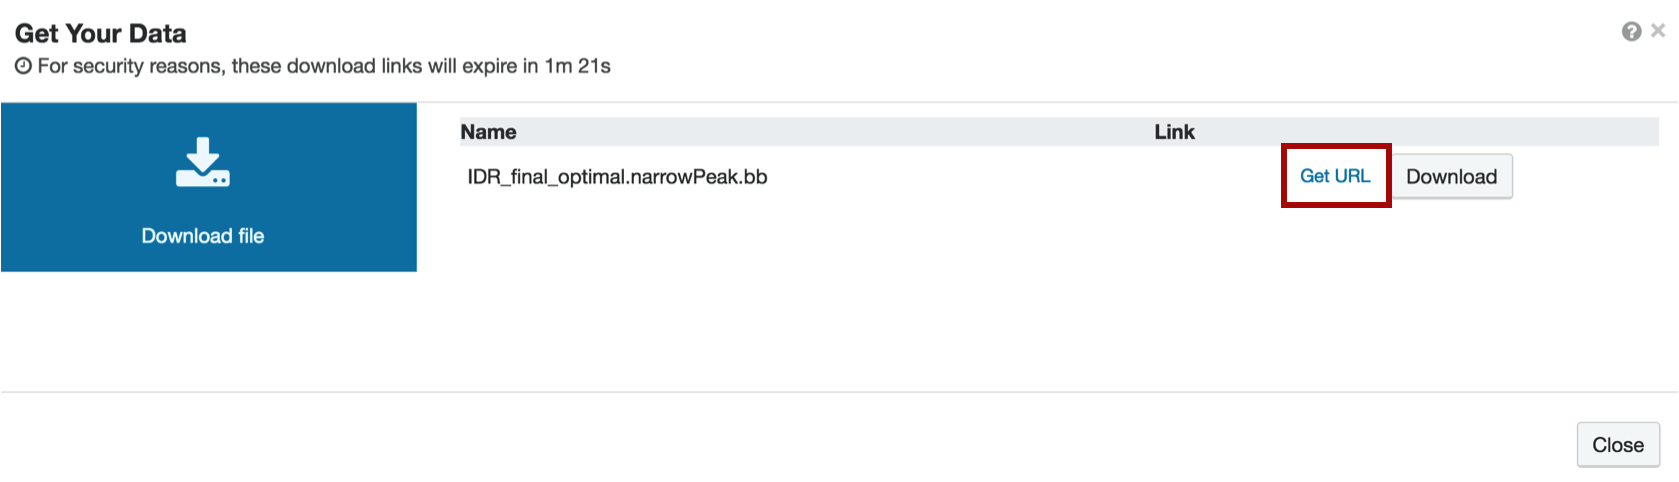
...and find that file in your project: go to the Manage tab and click on the idr2 folder. Choose your file (IDR_final_optimal.narrowPeak.bb) and click "Download".
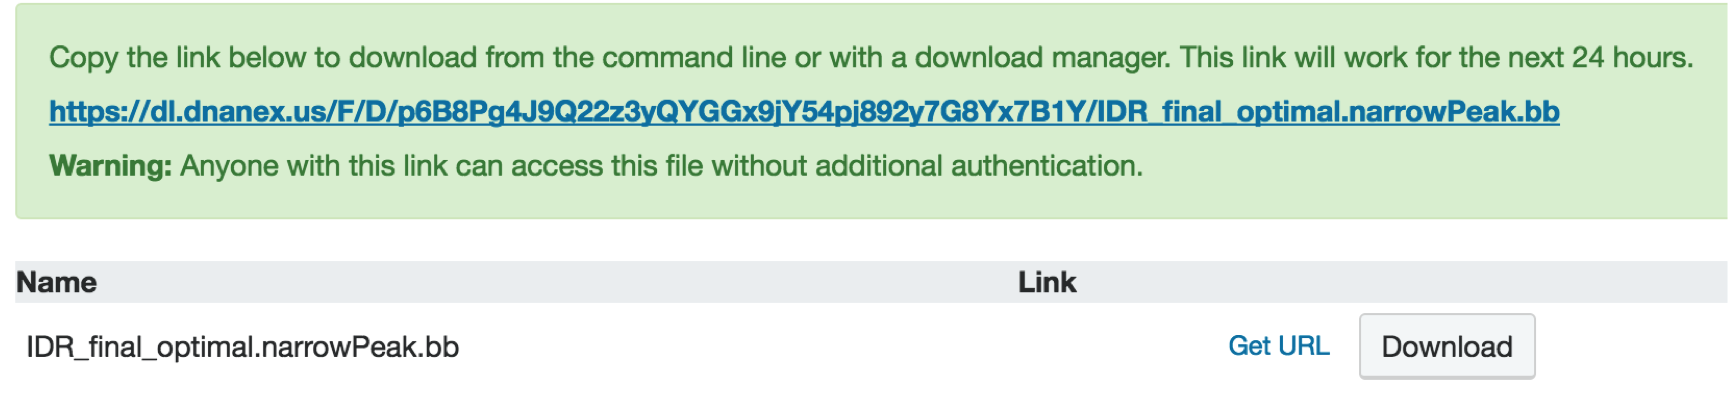
When you get to the download page, do not click Download. Instead, choose "Get url" next to the Download button and copy the resulting file url by right-clicking and selecting "Copy".
11. Visualizing your data on the UCSC Genome Browser
METHOD 1
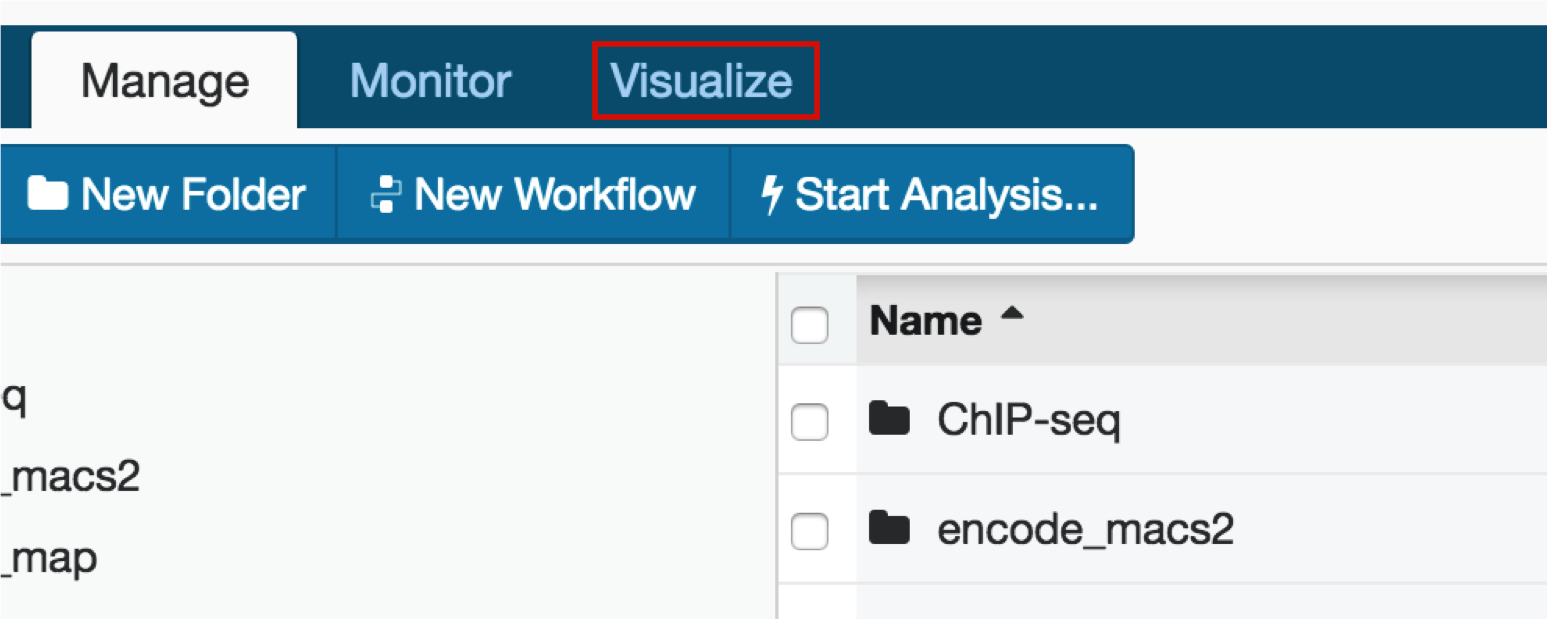
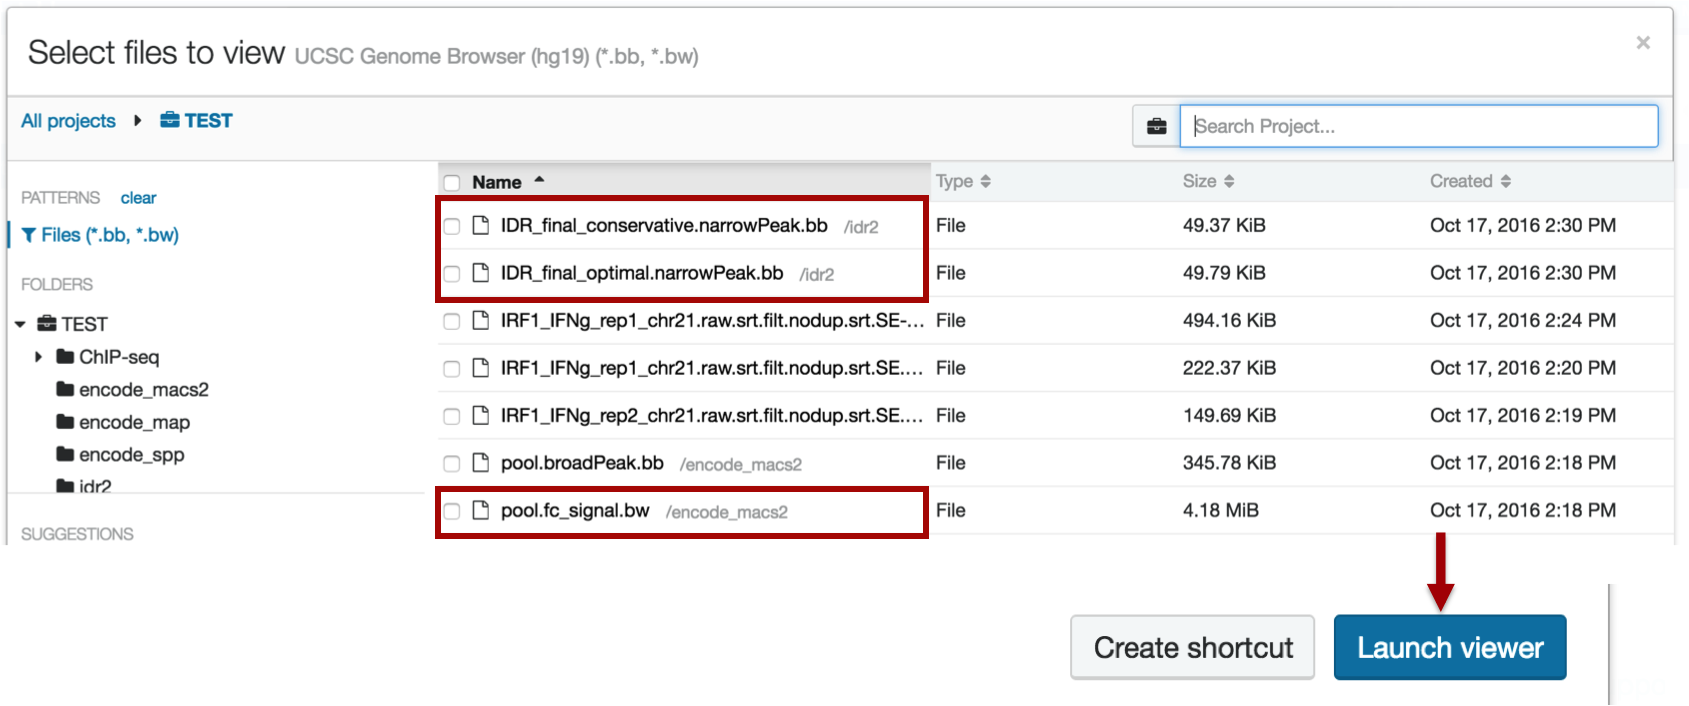
Click on the Visualize tab in your DNA Nexus project.
We will visualize our hg19 analysis on the UCSC Genome Browser
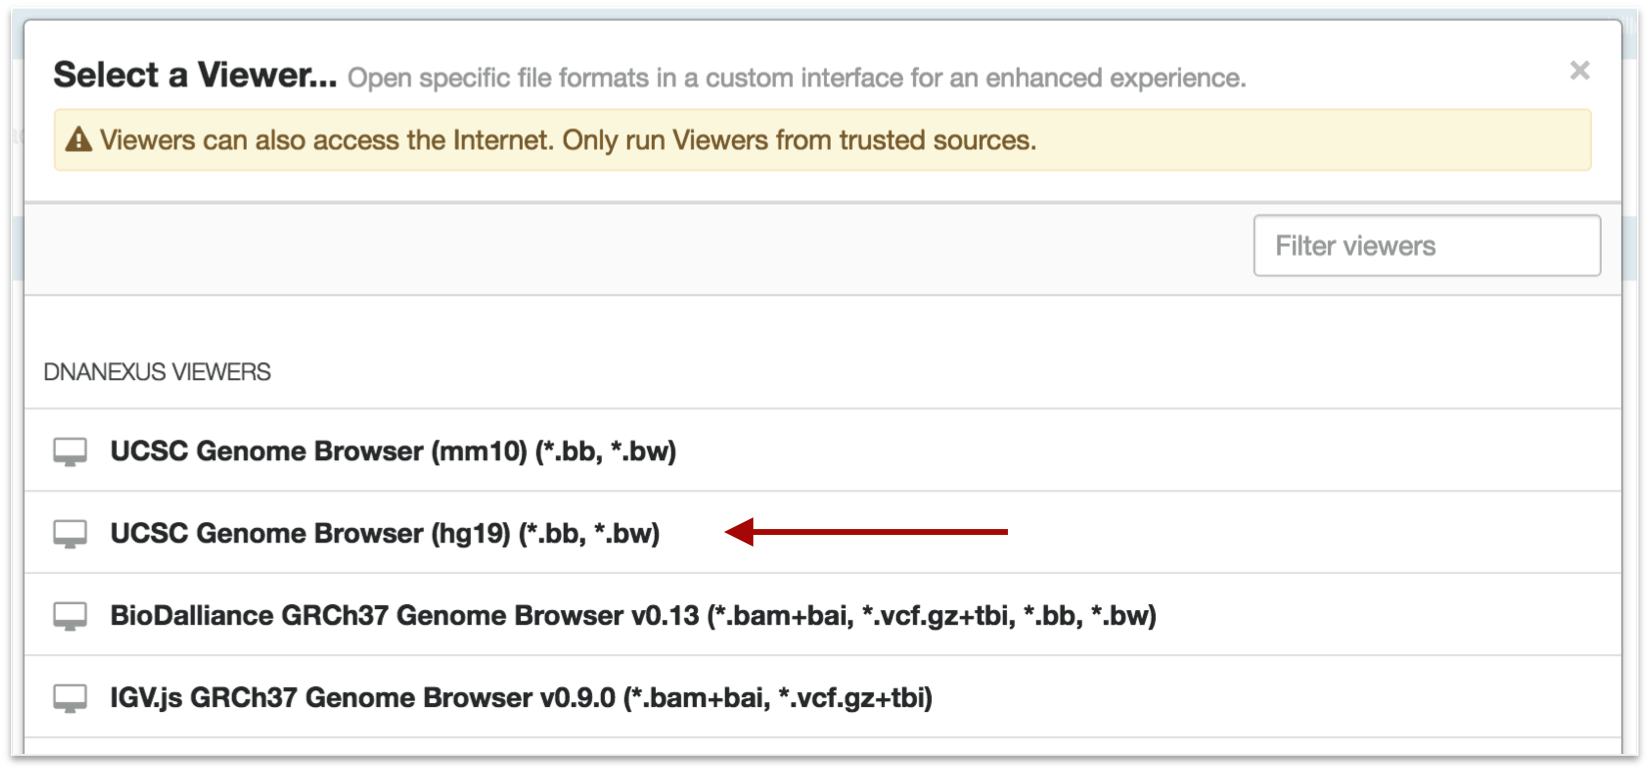
Select your peak files and click "Launch Viewer"
METHOD 2
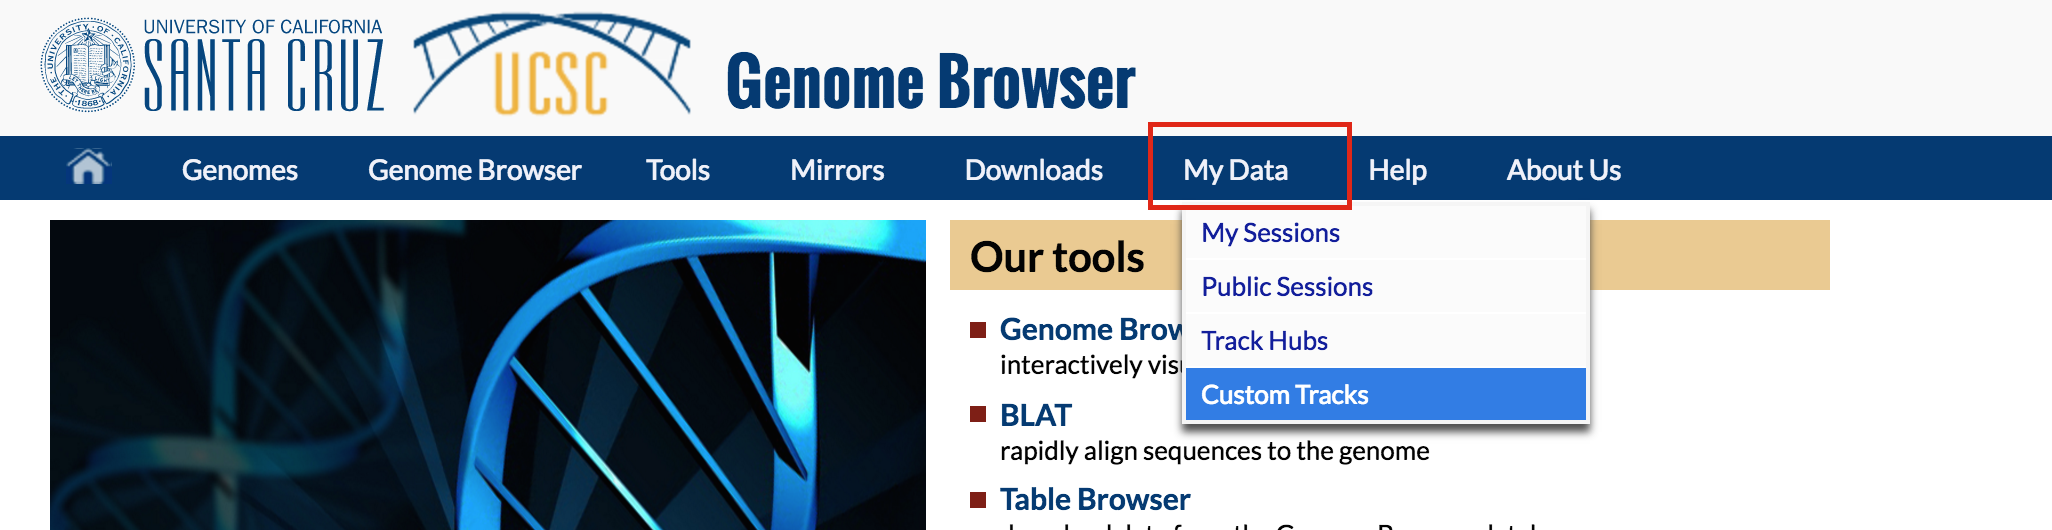
In a new tab or window, go to genome.ucsc.edu. Select the My Data tab and choose "Custom Tracks"
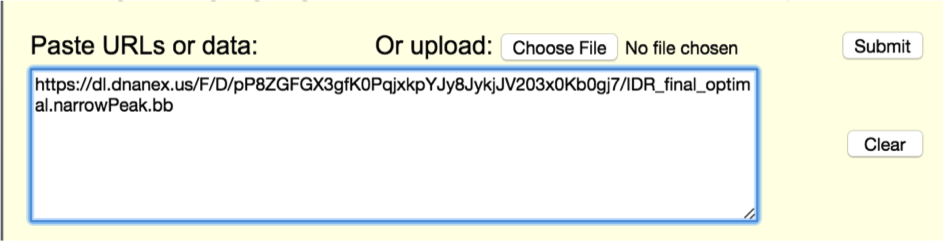
Paste the url you copied from DNA Nexus into the box titled "Paste URLs or data". Then click submit.
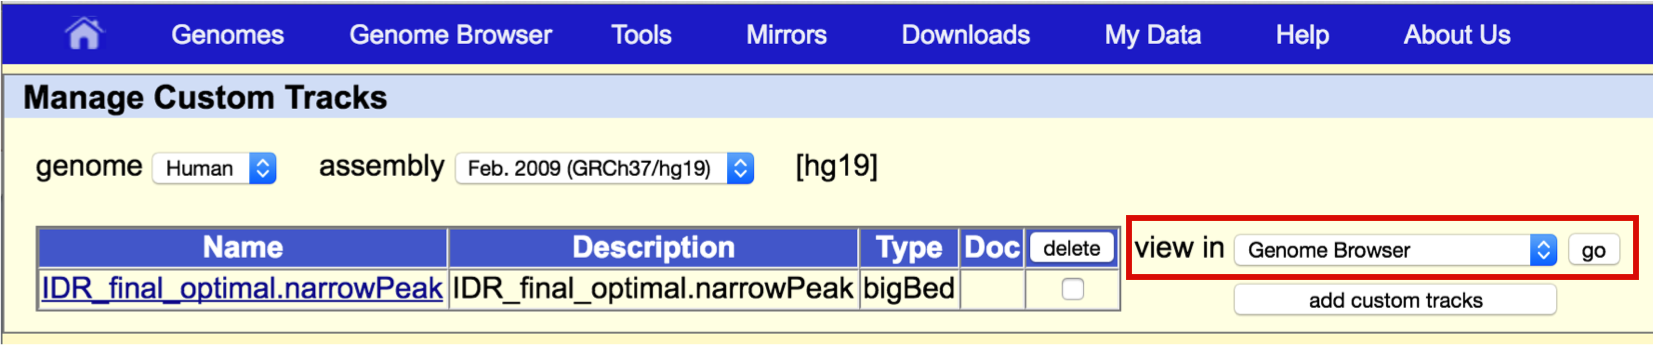
From the Manage Custom Tracks page, make sure the "view in" field says "Genome Browser" and click go
You can now toggle the viewing parameters (for example, zoom in or out) as you choose.