ATAC-seq Data Standards and Processing Pipeline
Assay overview
The Assay for Transposase-Accessible Chromatin followed by sequencing (ATAC-seq) experiment provides genome-wide profiles of chromatin accessibility. Briefly, the ATAC-seq method works as follows: loaded transposase inserts sequencing primers into open chromatin sites across the genome, and reads are then sequenced. The ends of the reads mark open chromatin sites.
Updated July 2020
Pipeline Overview
The ATAC-seq pipeline was developed by Anshul Kundaje's lab at Stanford University. Upon revision and full implementation, it will be a part of the ENCODE Uniform Processing Pipelines series. The full ATAC-seq pipeline code is available on Github.
The ENCODE ATAC-seq pipeline is used for quality control and statistical signal processing of short-read sequencing data, producing alignments and measures of enrichment.
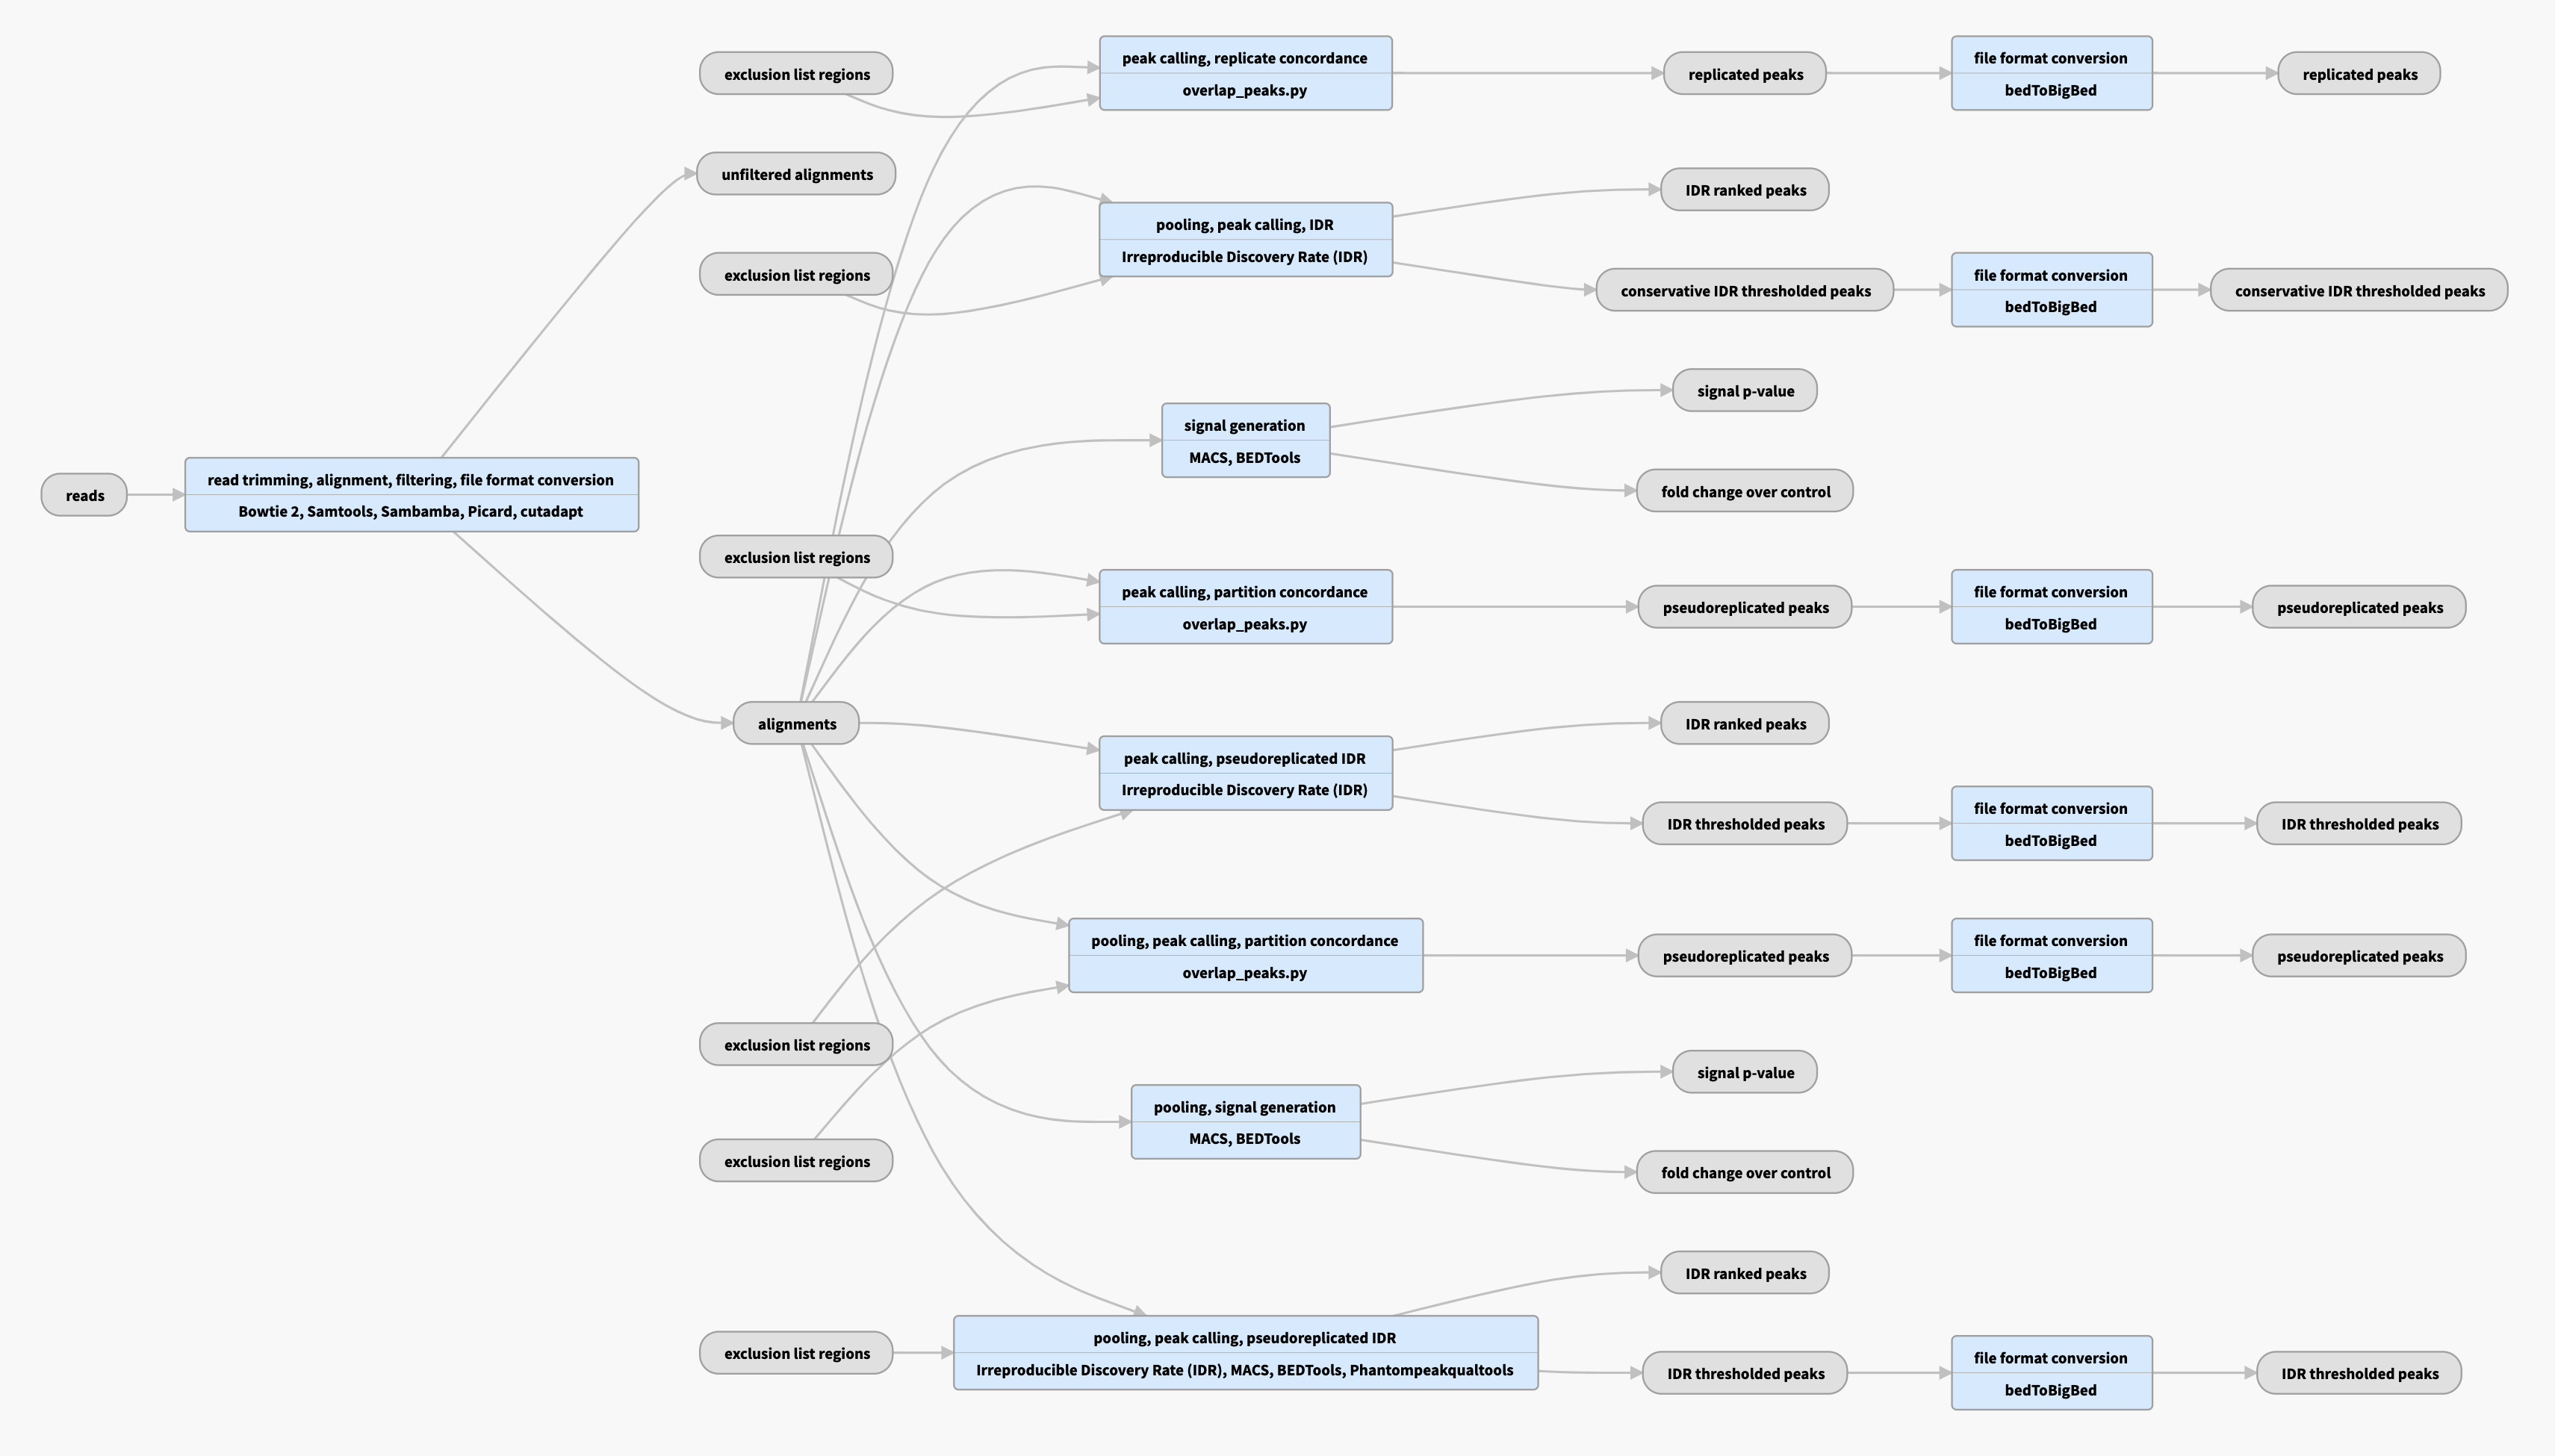
Pipeline schematic for replicated data
View the current instances of the pipeline for replicated data
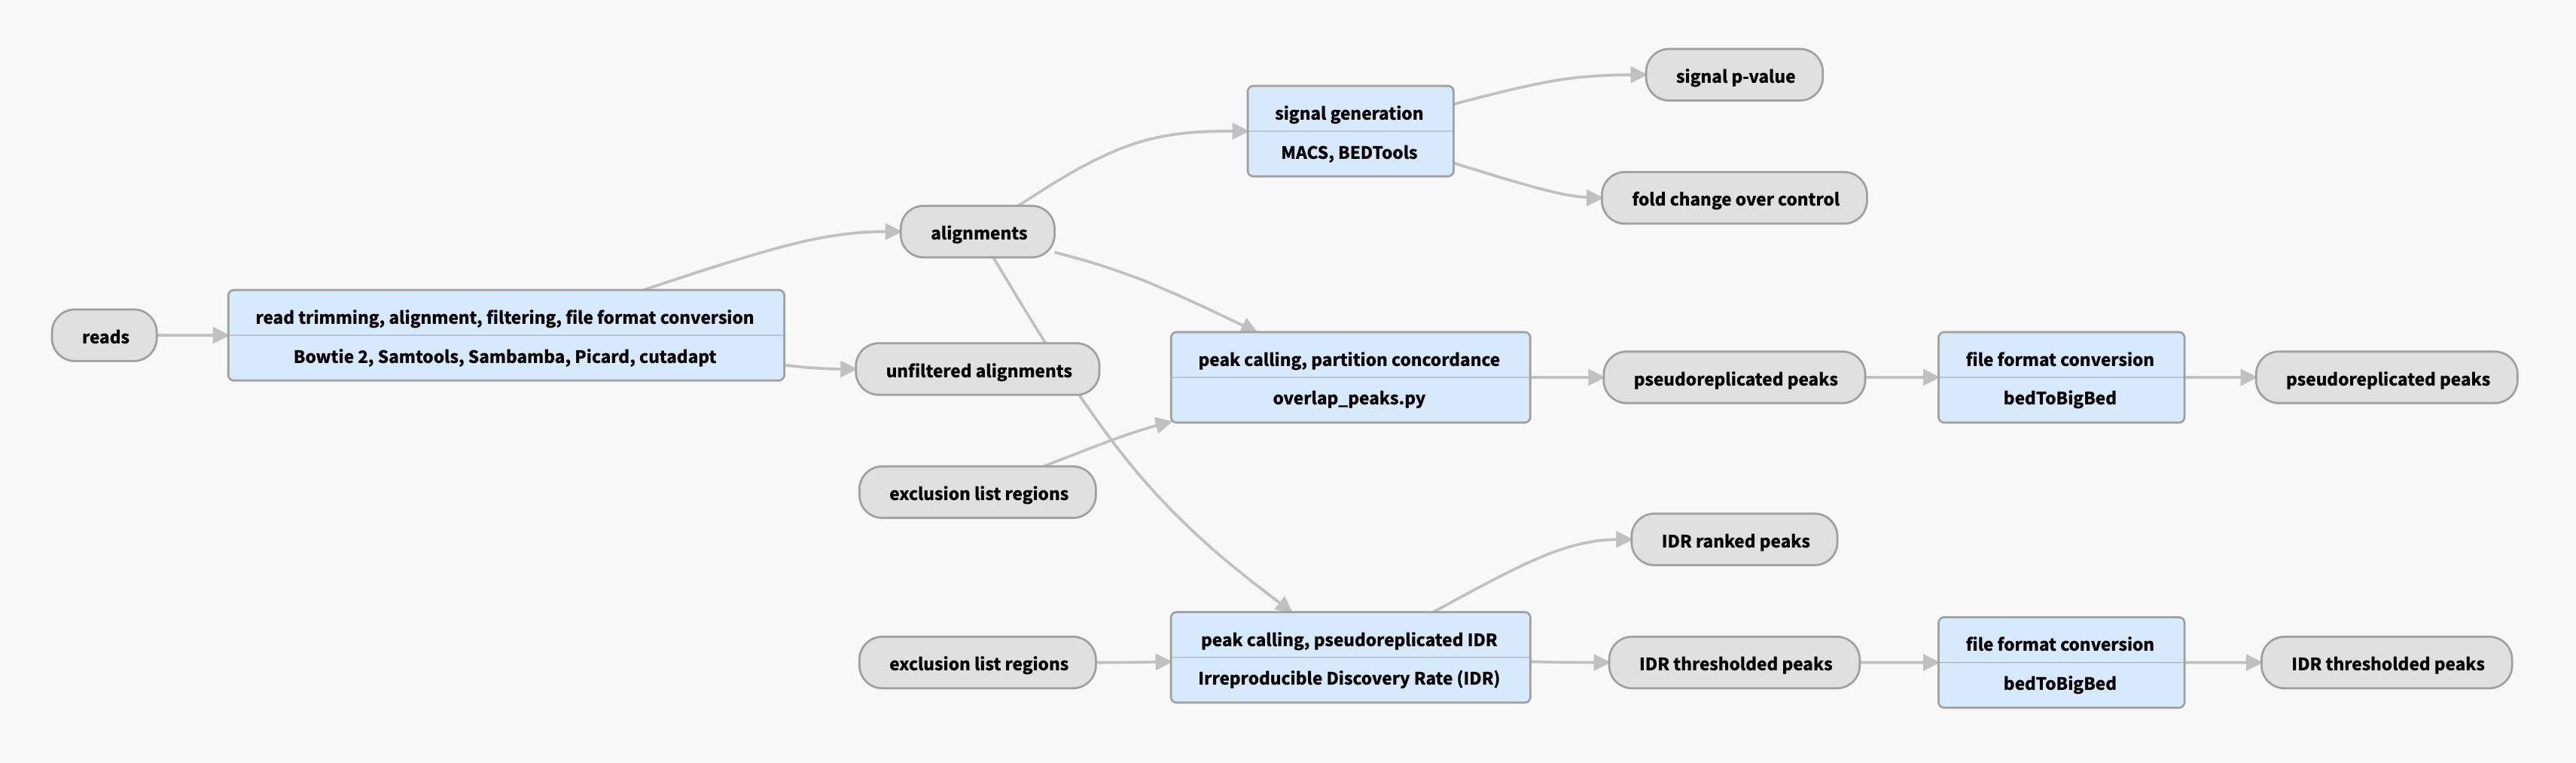
Pipeline schematic for unreplicated data
View the current instances of the pipeline for unreplicated data
Inputs:
| File format |
Information contained in file |
File description |
Notes |
| fastq |
reads |
G-zipped, paired-ended or single-ended ATAC-seq reads | Reads must meet the criteria outlined under the Uniform Processing Pipeline Restrictions. |
Outputs:
| File format |
Information contained in file |
File description |
Notes |
| bam |
alignments and filtered alignments |
Produced by mapping reads to the genome |
Bowtie2 aligner is used to produce raw bam files, followed by various filtering steps (mappability and quality) to produce filtered bams. |
| bigWig | fold change over control, signal p-value | Two versions of nucleotide resolution signal coverage tracks |
These signals are the fold enrichment of signal over expected background and a p-value track representing statistical significance |
| bed and bigBed (narrowPeak) | pseudoreplicated peaks | The set of peak calls from two partitions, or "pseudoreplicates" |
In the "partition concordance" step, a similar "naive overlap" strategy is used to identify pseudoreplicated peaks across pseudoreplicates (instead of across true replicates). Pseudoreplicated peaks are peaks from the relaxed set that overlap at least 50% with peaks from both pseudoreplicates. |
|
Replicated datasets only |
|||
| bed and bigBed (narrowPeak) | conservative IDR peaks |
Peaks derived from IDR analysis of biological replicates. |
IDR, or Irreproducible Discovery Rate, measures the reproducibility of the assay in question. The optimal set of peaks is more sensitive, especially when one replicate has substantially lower data quality than the other. |
| bed and bigBed (narrowPeak) | optimal IDR peaks | The largest set of peaks derived from IDR analysis of biological replicates and pseudoreplicates. | |
| bed and bigBed (narrowPeak) | replicated peaks | The set of peak calls from the pooled replicates. |
These peaks are either observed in both replicates, or are observed in two pseudoreplicates. Pseudoreplicates are peak sets called on half of the pooled reads, chosen at random without replacement. |
|
|
|||
| bed and bigBed (narrowPeak) | pseudoreplicated IDR thresholded peaks | The set of peak calls from two partitions, or "pseudoreplicates" |
In the "unreplicated IDR" step, an IDR-based strategy is used to identify stable peaks across pseudoreplicates (instead of across true replicates). Peaks from the relaxed set (from all reads) as well as from pseudoreplicates are ranked, and those peaks that are well-supported in both pseudoreplicates (i.e. cross the same IDR threshold as for replicated experiments) are reported. There are no corresponding optimal and conservative peak sets in the unreplicated case because there are no true replicates. |
|
Quality control metrics are collected to determine library complexity, signal to noise ratios, fragment length distribution per replicate (where available), and reproducibility. |
|||
-
We recommend using the replicated peak when one prefers a low false negative rate but potentially higher false positives. We recommend using the IDR peaks when one prefers low false positive rates.
-
Some may notice that the peaks produced look both like peaks produced from the TF ChIP-seq pipeline as well as the histone ChIP-seq pipeline. This is intentional, as ATAC-seq data looks both like TF data (narrow peaks of signal) as well as histone data (broader regions of openness).
References
Genomic References
View the human (GRCh38) and mouse (mm10) reference files used in this pipeline
Links and Publications
Find data generated by the pipeline for unreplicated data
Find data generated by the pipeline for replicated data
Explore all ATAC-seq related publications on the ENCODE portal
Uniform Processing Pipeline Restrictions
- The read length prior to any trimming should be a minimum of 45 base pairs.
- Sequencing may be paired- or single-ended, as long as sequencing type is specified and paired sequences are indicated.
- All Illumina platforms are supported for use in the uniform pipeline, though data from different platforms should be processed separately; colorspace (SOLiD) reads are not supported.
- Barcodes, if present in the fastq, must be indicated.
- Library insert size range must be indicated.
Current Standards
- Experiments should have two or more biological replicates. Assays performed using EN-TEx samples may be exempted due to limited availability of experimental material, but at least two technical replicates are required.
- Each replicate should have 15 million non-duplicate, non-mitochondrial aligned reads for single-end sequencing and 50 million for paired-ended sequencing (i.e. 15 million fragments, regardless of sequencing run type).
- The alignment rate, or percentage of mapped reads, should be greater than 95%, though values >80% may be acceptable.
- Replicate concordance is measured by calculating IDR values (Irreproducible Discovery Rate). The experiment passes if both rescue and self consistency ratios are less than 2.
- Library complexity is measured using the Non-Redundant Fraction (NRF) and PCR Bottlenecking Coefficients 1 and 2, or PBC1 and PBC2. The preferred values are as follows: NRF>0.9, PBC1>0.9, and PBC2>3.
- Various peak files must meet certain requirements. Please visit the section on output files under the pipeline overview for more information on peak files.
- The number of peaks within a replicated peak file should be >150,000, though values >100,000 may be acceptable.
- The number of peaks within an IDR peak file should be >70,000, though values >50,000 may be acceptable.
- A nucleosome free region (NFR) must be present.
- A mononucleosome peak must be present in the fragment length distribution. These are reads that span a single nucleosome, so they are longer than 147 bp but shorter than 147*2 bp. Good ATAC-seq datasets have reads that span nucleosomes (which allows for calling nucleosome positions in addition to open regions of chromatin).
- The fraction of reads in called peak regions (FRiP score) should be >0.3, though values greater than 0.2 are acceptable. For EN-TEx tissues, FRiP scores will not be enforced as QC metric. TSS enrichment remains in place as a key signal to noise measure.
- Transcription start site (TSS) enrichment values are dependent on the reference files used; cutoff values for high quality data are listed in the table below.
| Annotation used | Value | Resulting Data Status |
|---|---|---|
| GRCh38 Refseq TSS annotation | < 5 | Concerning |
| 5 - 7 | Acceptable | |
| > 7 | Ideal | |
| mm10 Refseq TSS annotation | < 10 | Concerning |
| 10 -15 | Acceptable | |
| > 15 | Ideal |
- The experiment must pass routine metadata audits in order to be released.