ENCODE Encyclopedia, Version 0.3 (Archived): Overview
Introduction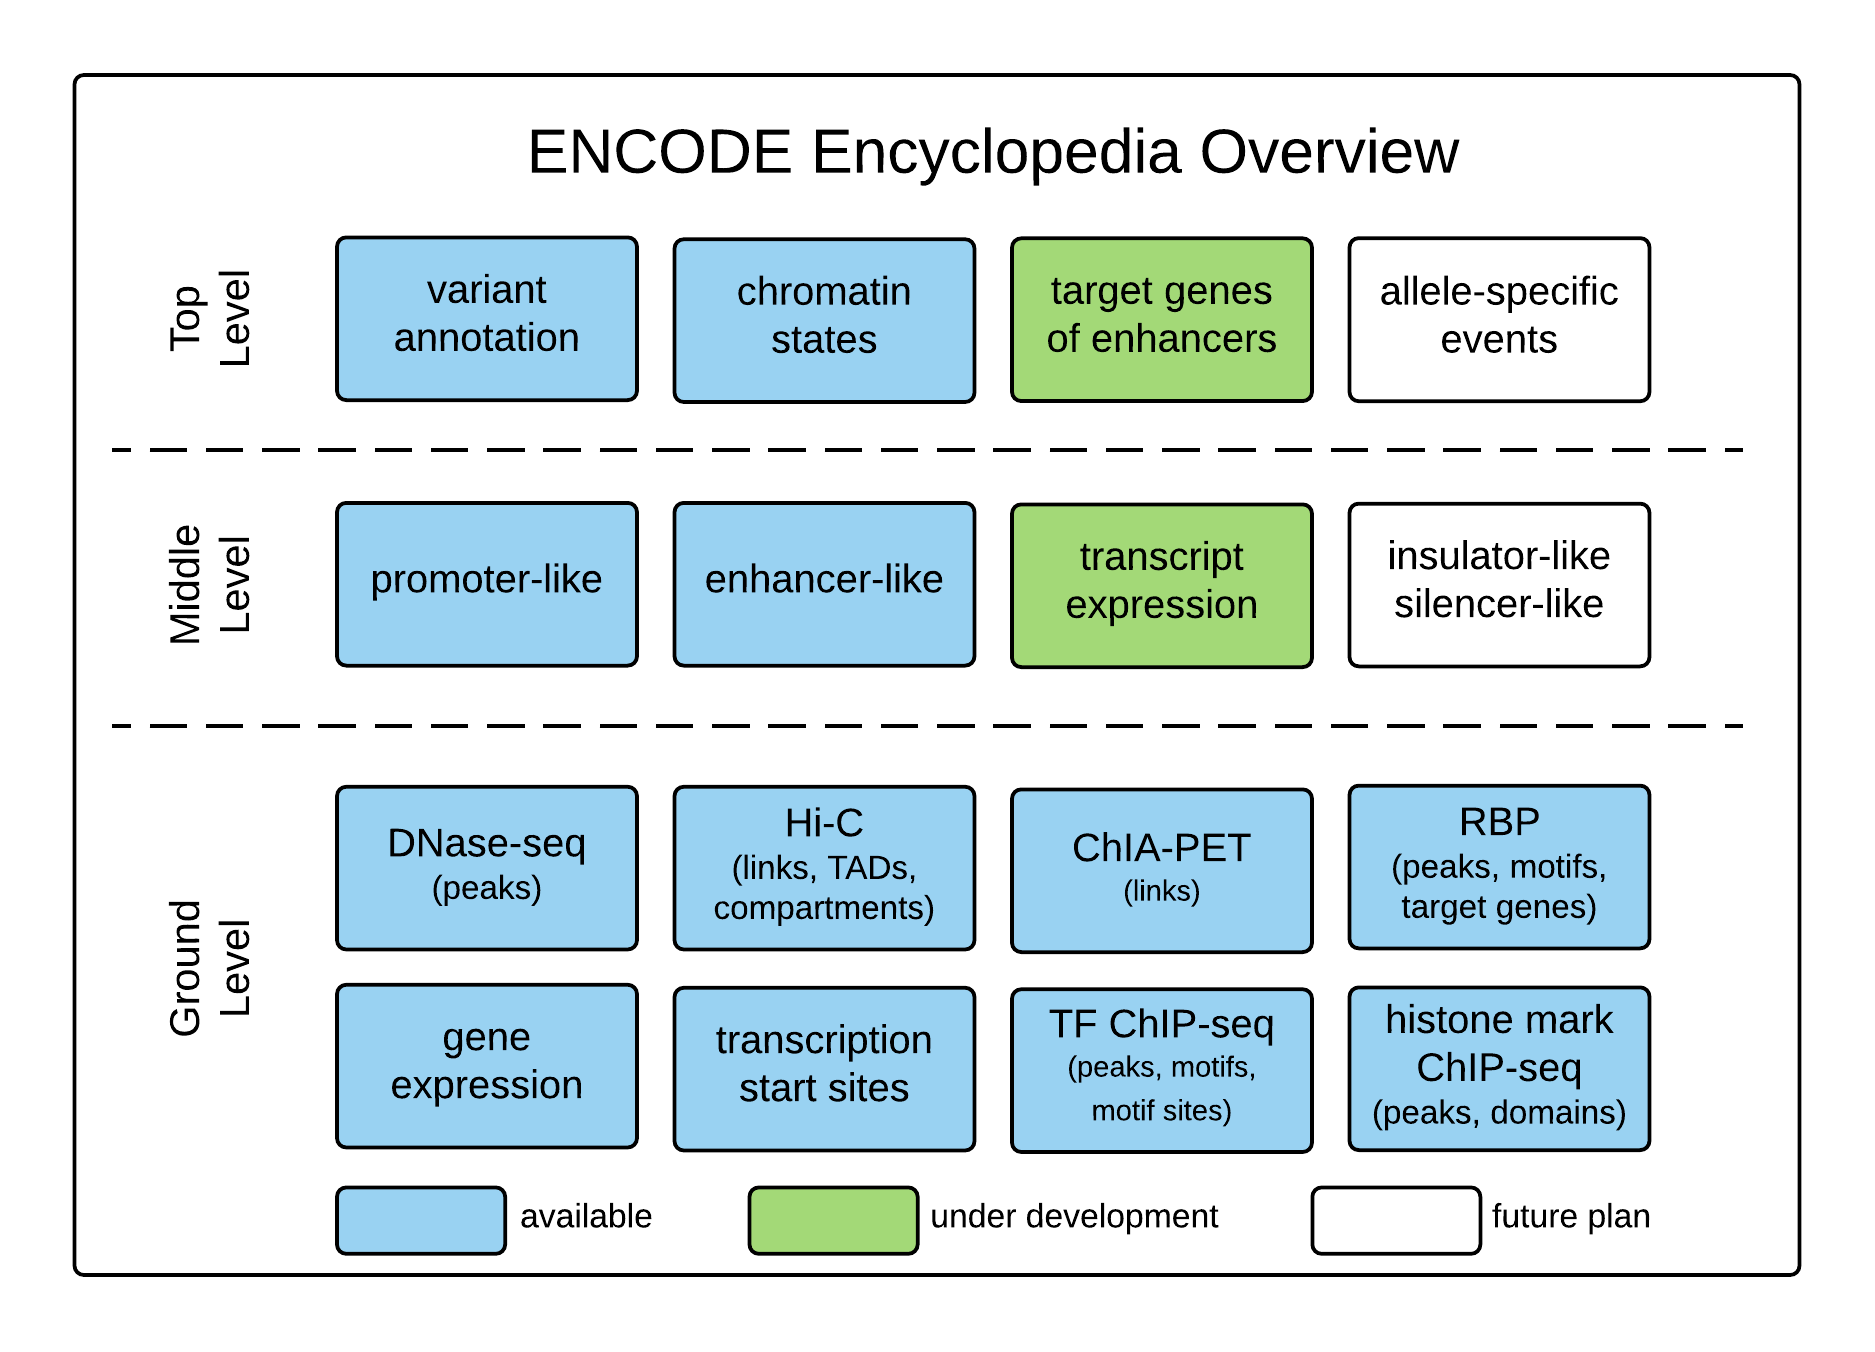
The ENCODE Consortium not only produces data, but also analyzes the data in an integrative fashion. The ENCODE Encyclopedia organizes the most salient analysis products into annotations, and provides tools to search and visualize them. The Encyclopedia has three levels of annotations:
- Ground level annotations are typically derived directly from the experimental data.
- Middle level annotations integrate multiple types of experimental data and multiple ground level annotations.
- Top level annotations integrate a broad range of experimental data and ground and middle level annotations.
Ground Level Annotations
Gene expression (RNA-seq)The expression levels of genes and transcripts annotated by GENCODE in over 200 human and 90 mouse experiments. |
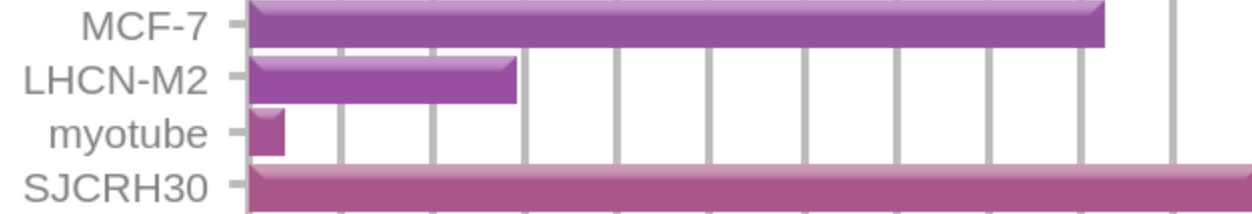 BRCA1 Gene Expression |
Transcription factor binding (TF ChIP-seq)Peaks (enriched genomic regions) of TFs computed from ~900 human and mouse ChIP-seq experiments. |
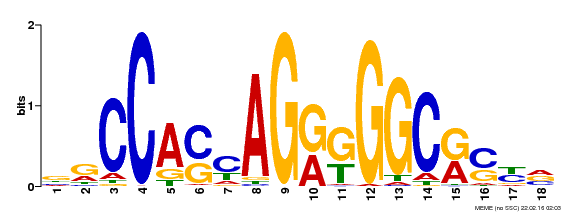 CTCF Motif from Factorbook
|
Histone mark enrichment (ChIP-seq)Peaks of a variety of histone marks computed from ~600 ChIP-seq experiments. |
 H3K27ac from e11.5 Neural Tube |
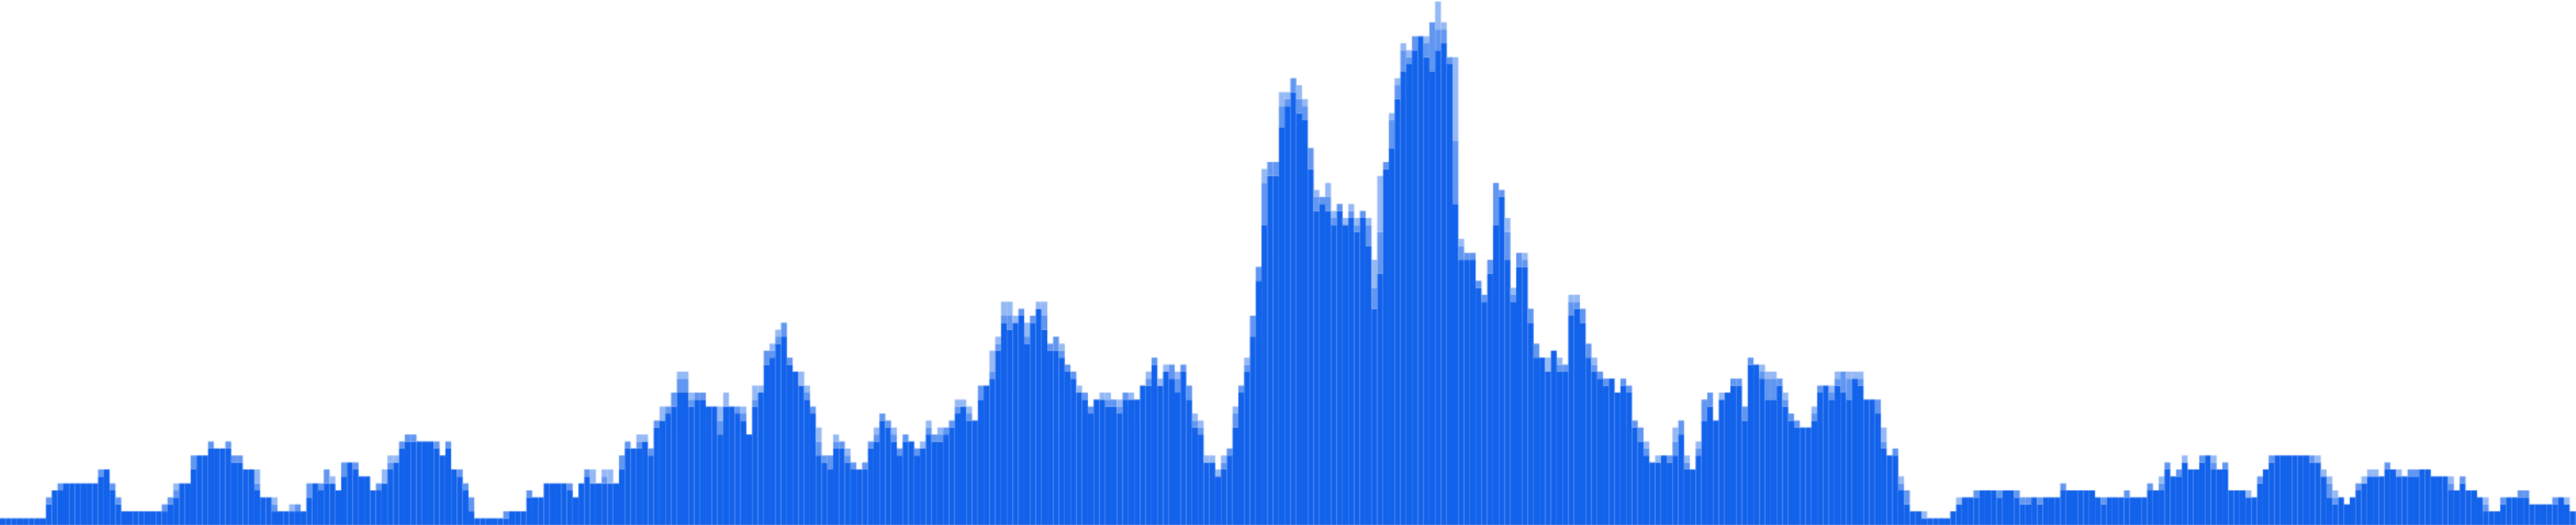
Open chromatin (DNase-seq)DNase I hypersensitive sites (also known as DNase-seq peaks) computed from ~300 human and mouse experiments. |
 CTCF DHS Profile |
Topologically associating domains (TADs) and compartments (Hi-C)TADs and A and B compartments computed from 12 human cell lines. |
 K562 Interaction Matrix |
Promoter-enhancer links (ChIA-PET)Links between promoters and distal regulatory elements such as enhancers computed from 8 ChIA-PET experiments. |
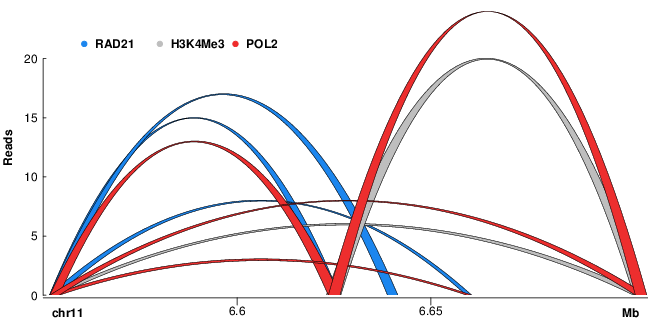 ChIA-PET interactions |
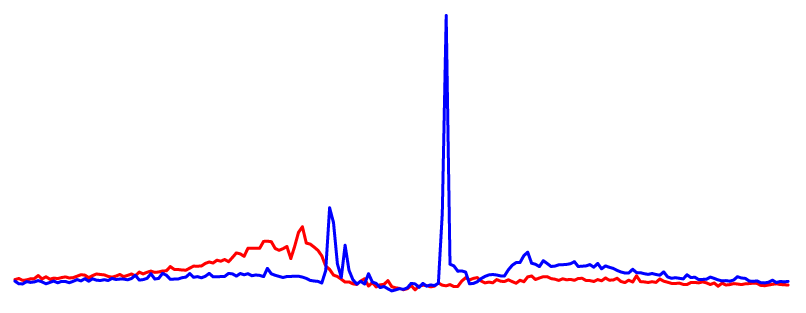
RNA binding protein occupancy (eCLIP-seq)Peaks computed from eCLIP-seq data in human cell lines K562 and HepG2 for a large number of RNA Binding Proteins (RBPs). |
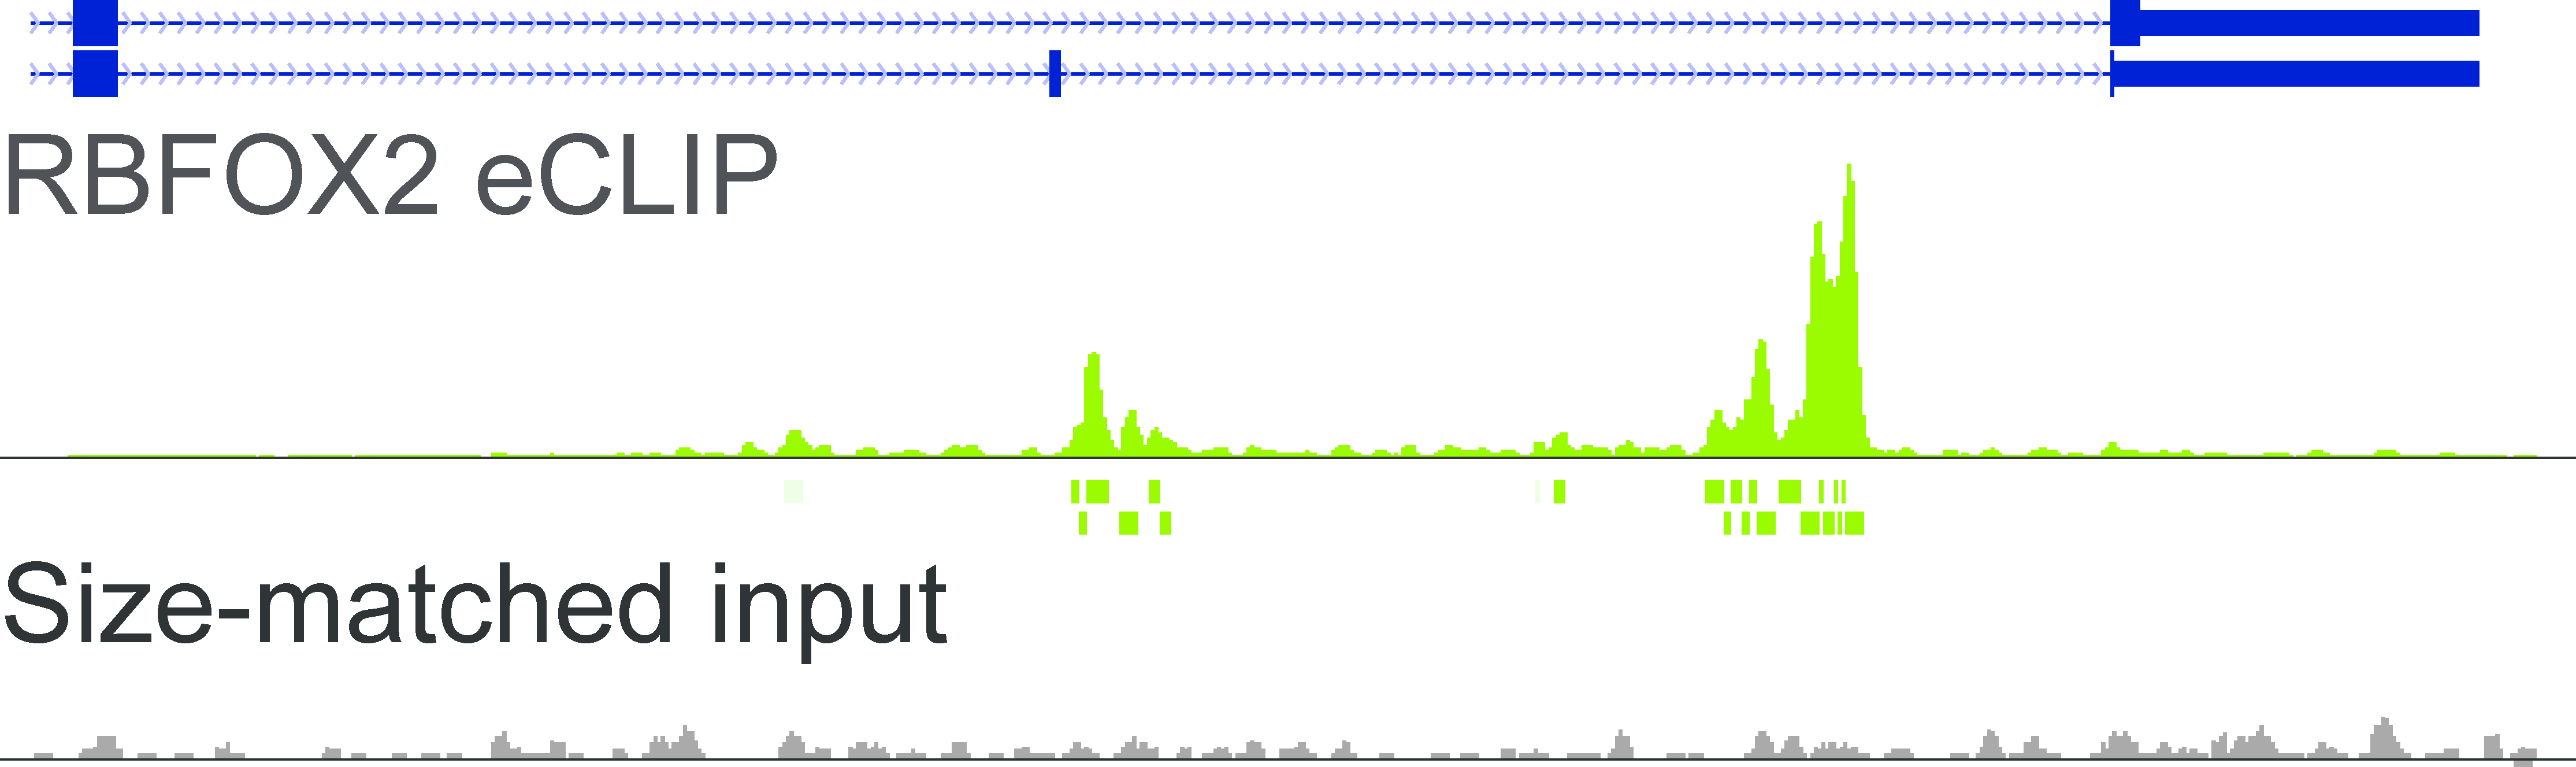 RBFOX2 read density |
Middle Level Annotations
Promoter-like regionsDNase hypersensitivity and histone modification H3K4me3 are well-known indicators of promoter function. We have developed an unsupervised method that combines DNase and H3K4me3 signals in the same cell type to predict promoter-like regions. When used to predict ranked gene expression from RNA-seq data, our method shows higher accuracy than DNase and H3K4me3 individually. We have applied this method to 107 human cell types and 14 mouse cell types with both DNase and H3K4me3 data generated by the ENCODE and Roadmap Epigenomic consortia. For cell and tissues types with only H3K4me3 data, we centered predictions on H3K4me3 peaks and ranked them by H3K4me3 signals. You can query these promoter-like regions by genomic locations, nearby genes, or SNPs, and visualize them in the UCSC and WashU genome browsers. |
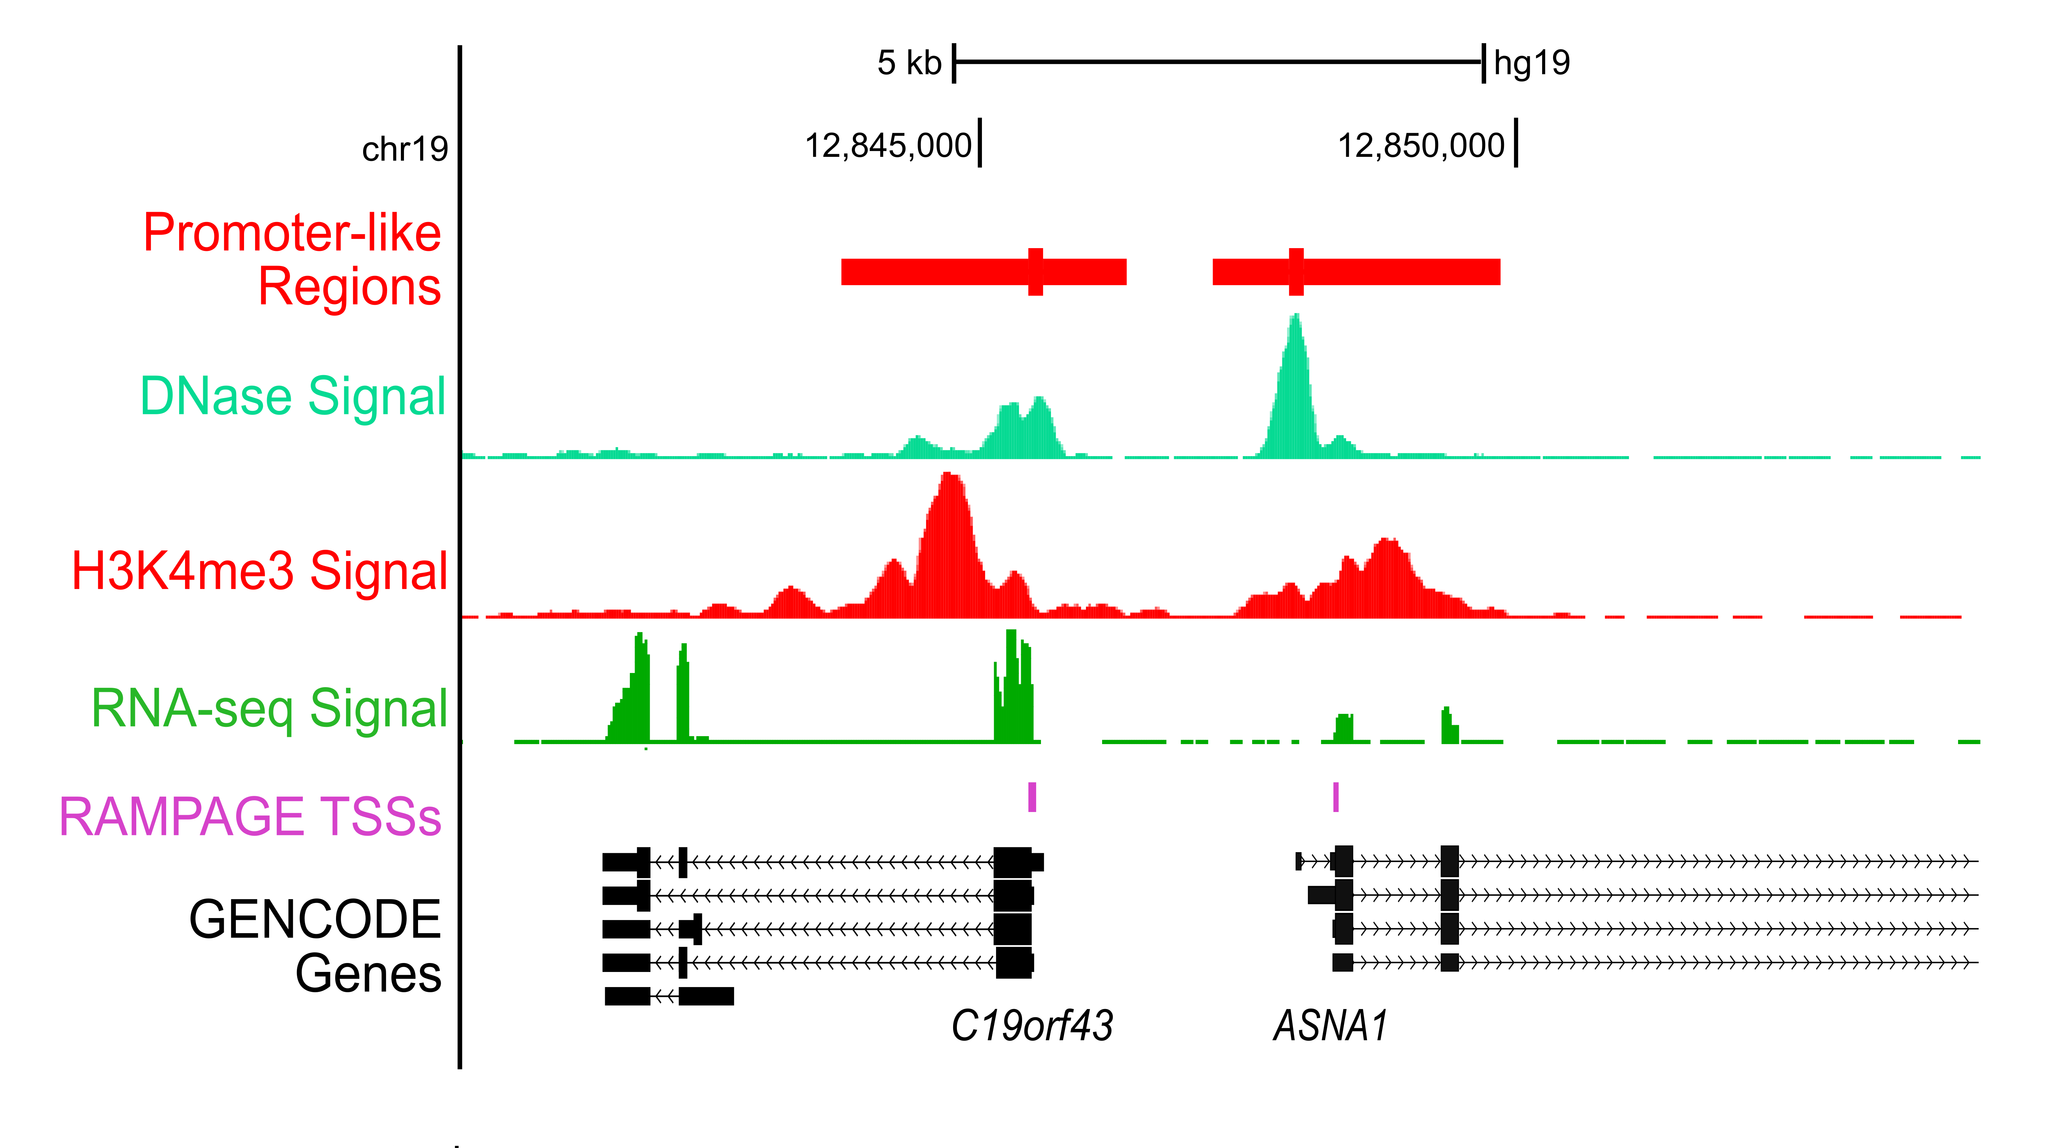 |
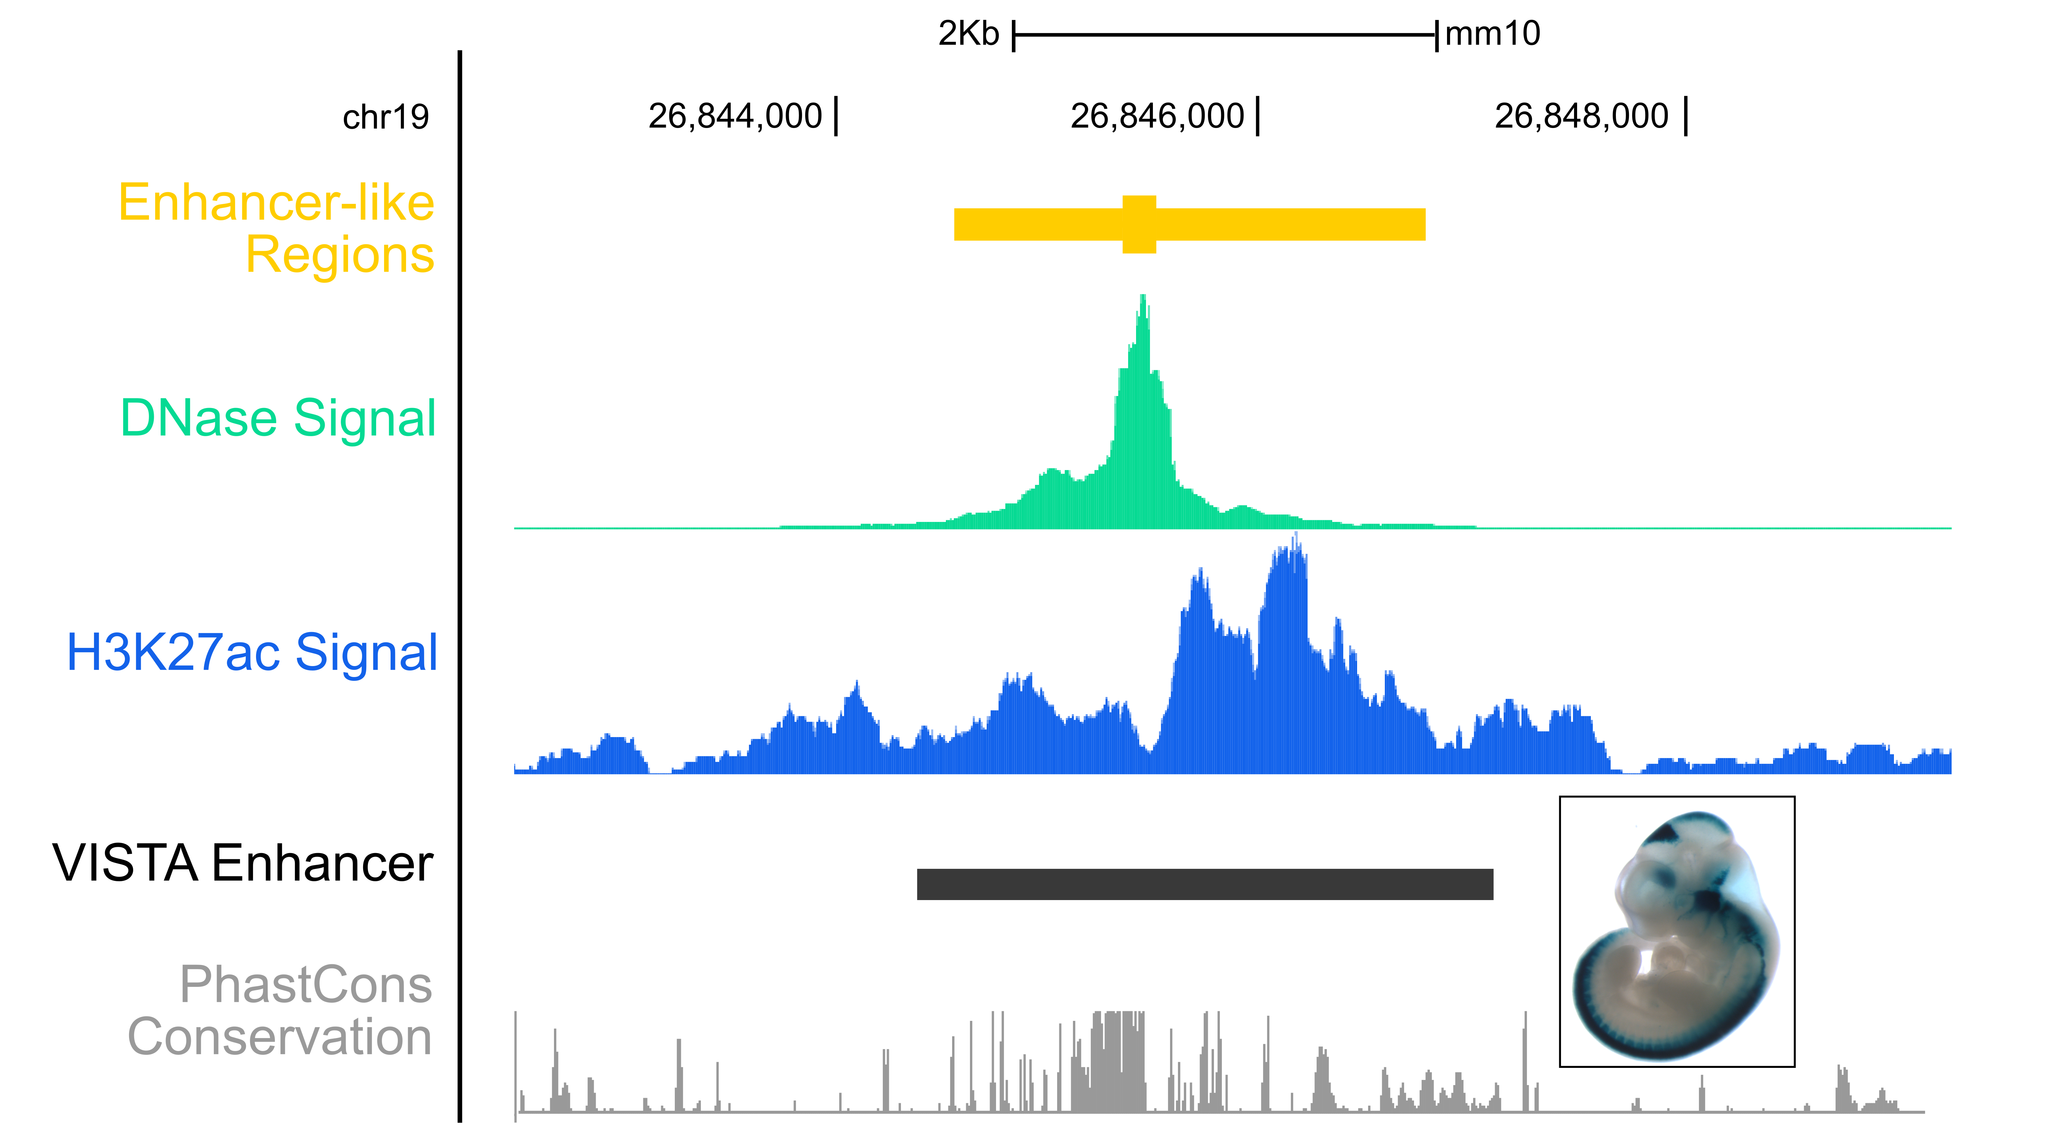
Enhancer-like regionsDNase hypersensitivity and histone modification H3K27ac are well-known indicators of enhancer function. We have developed an unsupervised method that combines DNase and H3K27ac signals in the same cell type to predict enhancer-like regions. When tested on mouse transgenic assays, our method shows higher accuracy than DNase and H3K27ac individually. We have applied this method to 47 human cell types and 14 mouse cell types with both DNase and H3K27ac data generated by the ENCODE and Roadmap Epigenomic consortia. For cell and tissues types with only H3K27ac or DNase data, we rank the peaks using the available data and make predictions of enhancer-like regions. You can query these enhancers by genomic locations, nearby genes, or SNPs, and visualize them in the UCSC and WashU genome browsers. |
 |
|
Enhancer-like genomic regions were tested on VISTA experimentally-validated enhancer elements: [ VISTA ] |
Top Level Annotations
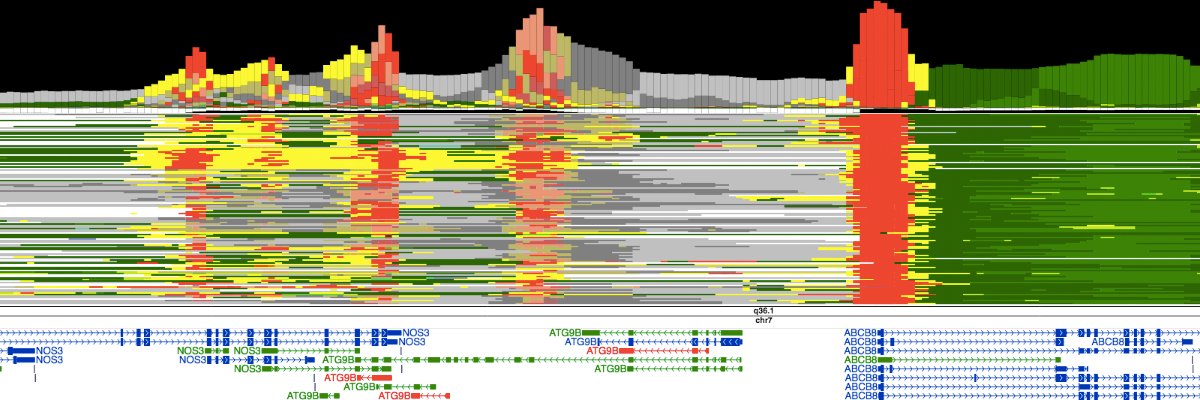
Chromatin statesSemi-automated genomic annotation methods such as ChromHMM and Segway take as input a panel of epigenomic data (including histone mark ChIP-seq and DNase-seq) in a particular cell type and use machine learning methods to simultaneously partition the genome into segments and assign chromatin states to these segments; the states are assigned such that two segments with the same state exhibit similar epigenomic patterns. The procedure is "semi-automated" because states are then manually compared with known biological information in order to designate each state as an enhancer-like, promoter-like, gene body, etc. |
|
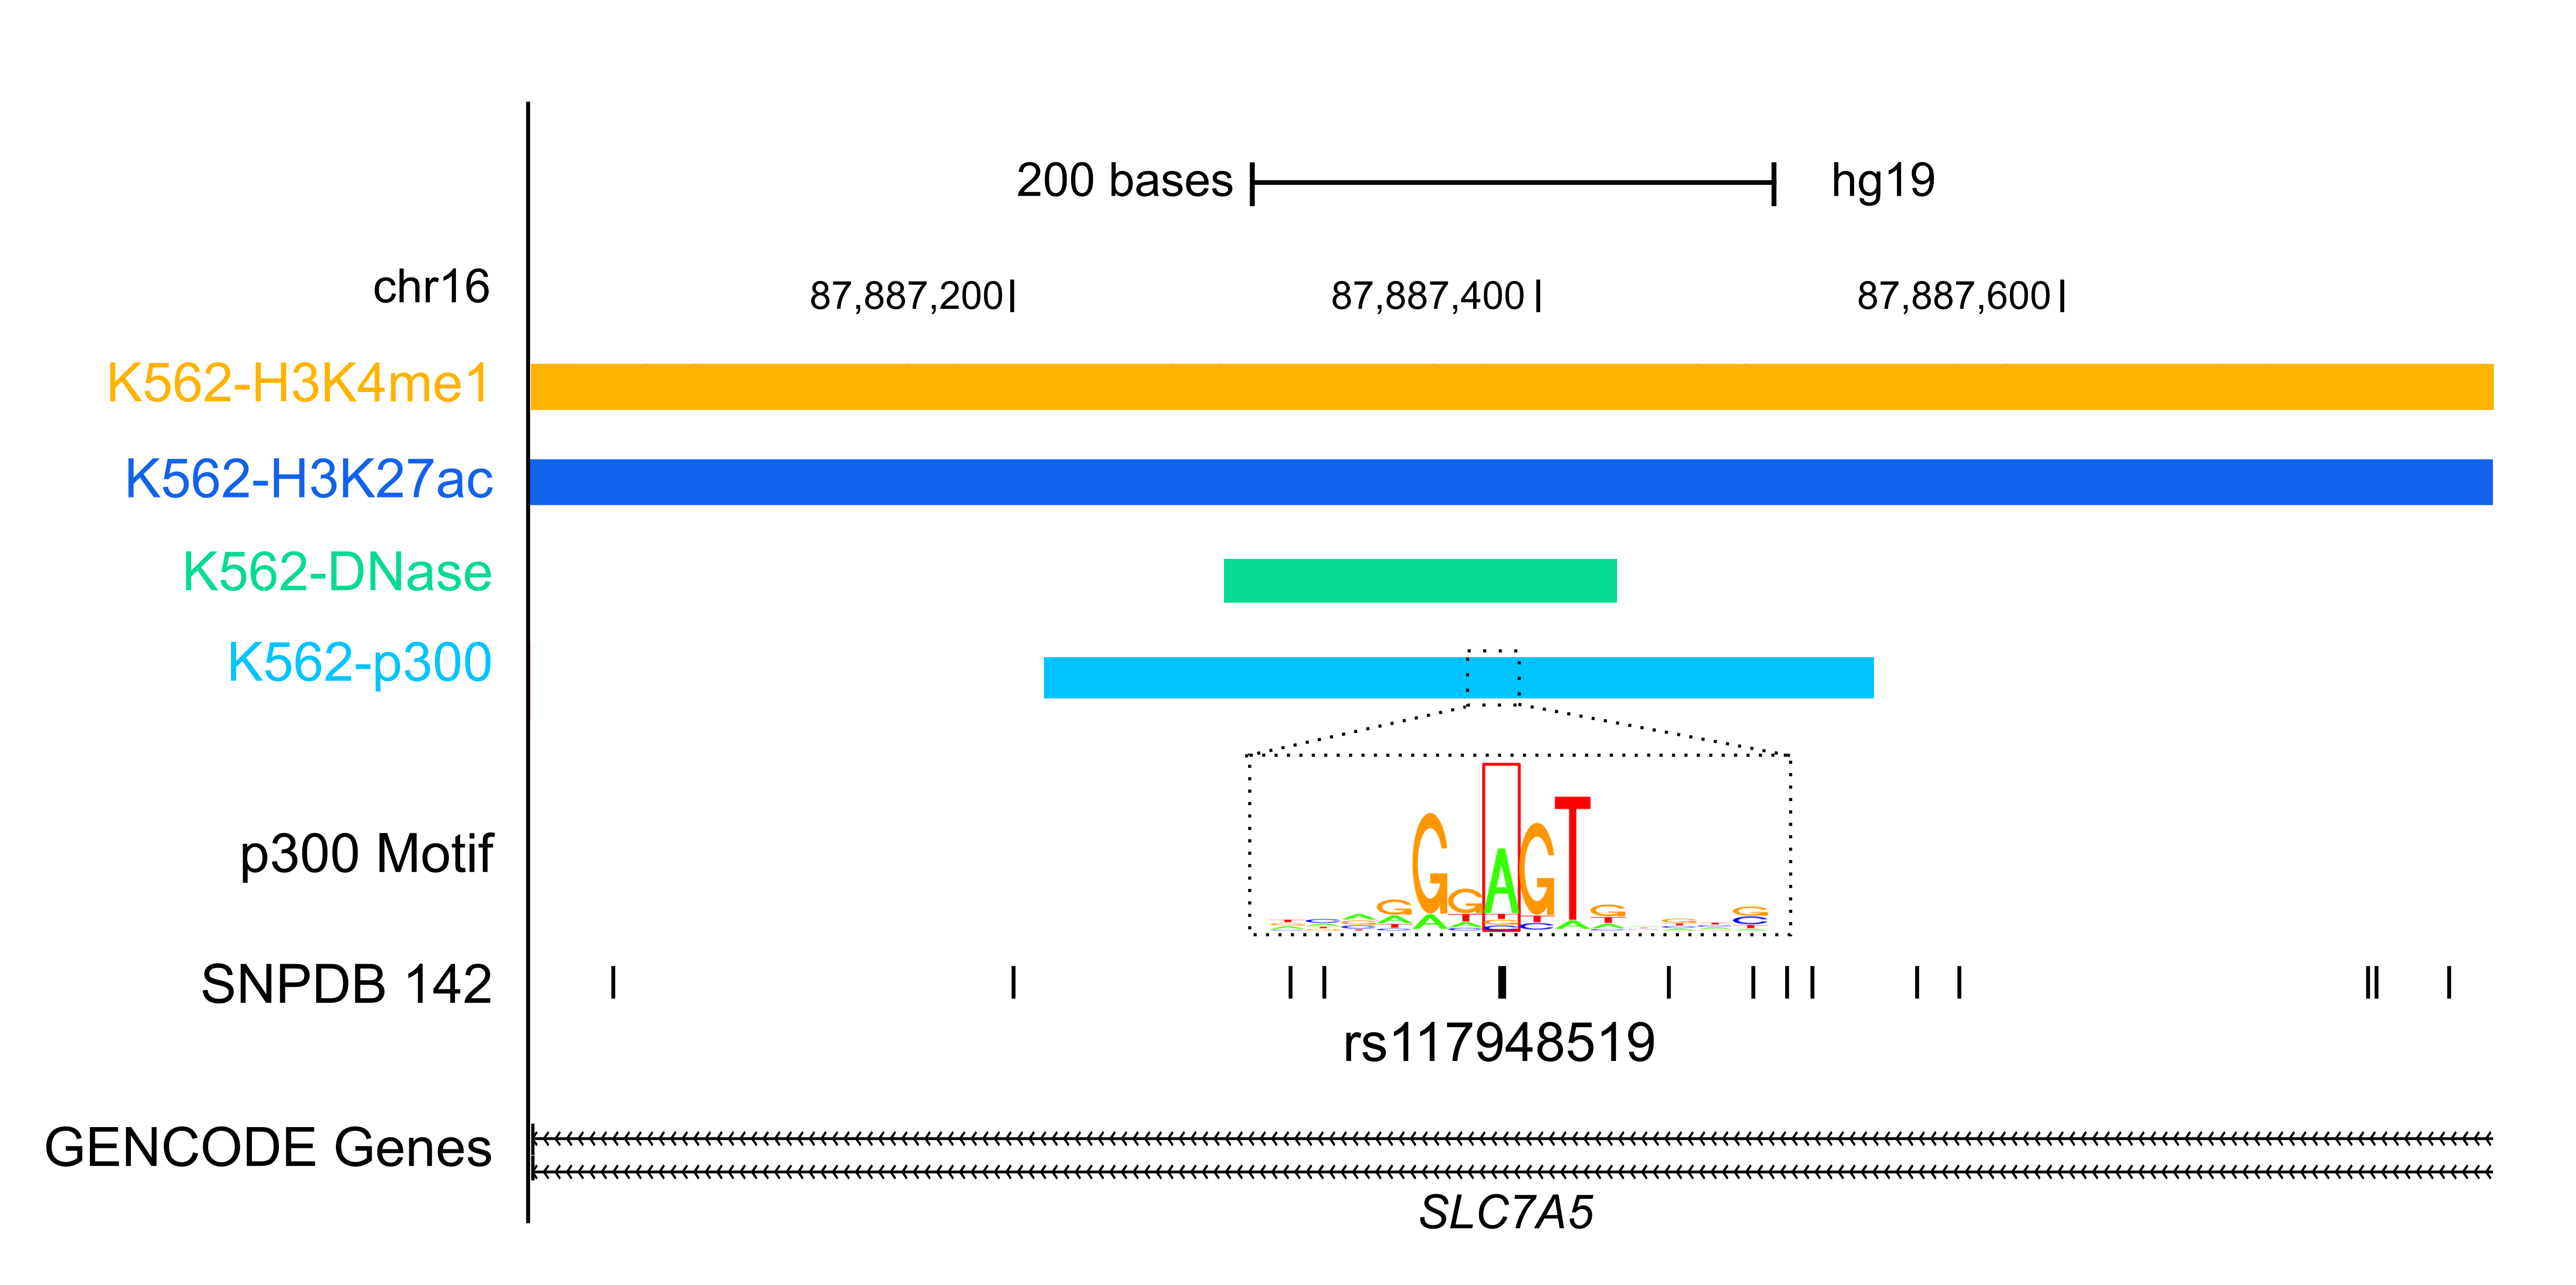
Variant AnnotationOver the past decade, Genome Wide Association Studies (GWAS) have provided insights into how genetic variations contribute to human diseases. However, over 80% of the variants reported by GWAS are in noncoding regions of the genome and the mechanism of how they contribute to disease onset is unknown. By integrating data from the ENCODE project and other public sources, RegulomeDB and HaploReg are two resources developed by ENCODE labs to aid the research community in annotating GWAS variants. FunSeq is another ENCODE resource for annotating both germline and somatic variants, particularly in the noncoding regions of cancer genomes. |
 |
Acknowledgements
Data from the Common fund supported Roadmap Epigenomics Mapping Consortium (REMC) were included for building the ENCODE Encyclopedia. Please see the 2015 paper on their analysis of reference human genomes for more information.