ENCAB698FCU
Antibody against Homo sapiens DEAF1
Homo sapiens
K562, HepG2
characterized to standards with exemption
- Status
- released
- Source (vendor)
- GeneTex
- Product ID
- GTX115430
- Lot ID
- 40583
- Characterized targets
- DEAF1 (Homo sapiens)
- Host
- rabbit
- Clonality
- polyclonal
- Purification
- affinity
- Isotype
- IgG
- Antigen description
- Recomb fragment corresp to region w/in amino acids 141 and 453 of DEAF1 (Uniprot ID#O75398)
- External resources
Characterizations
DEAF1 (Homo sapiens)
Method: immunoprecipitation followed by mass spectrometry
not compliant
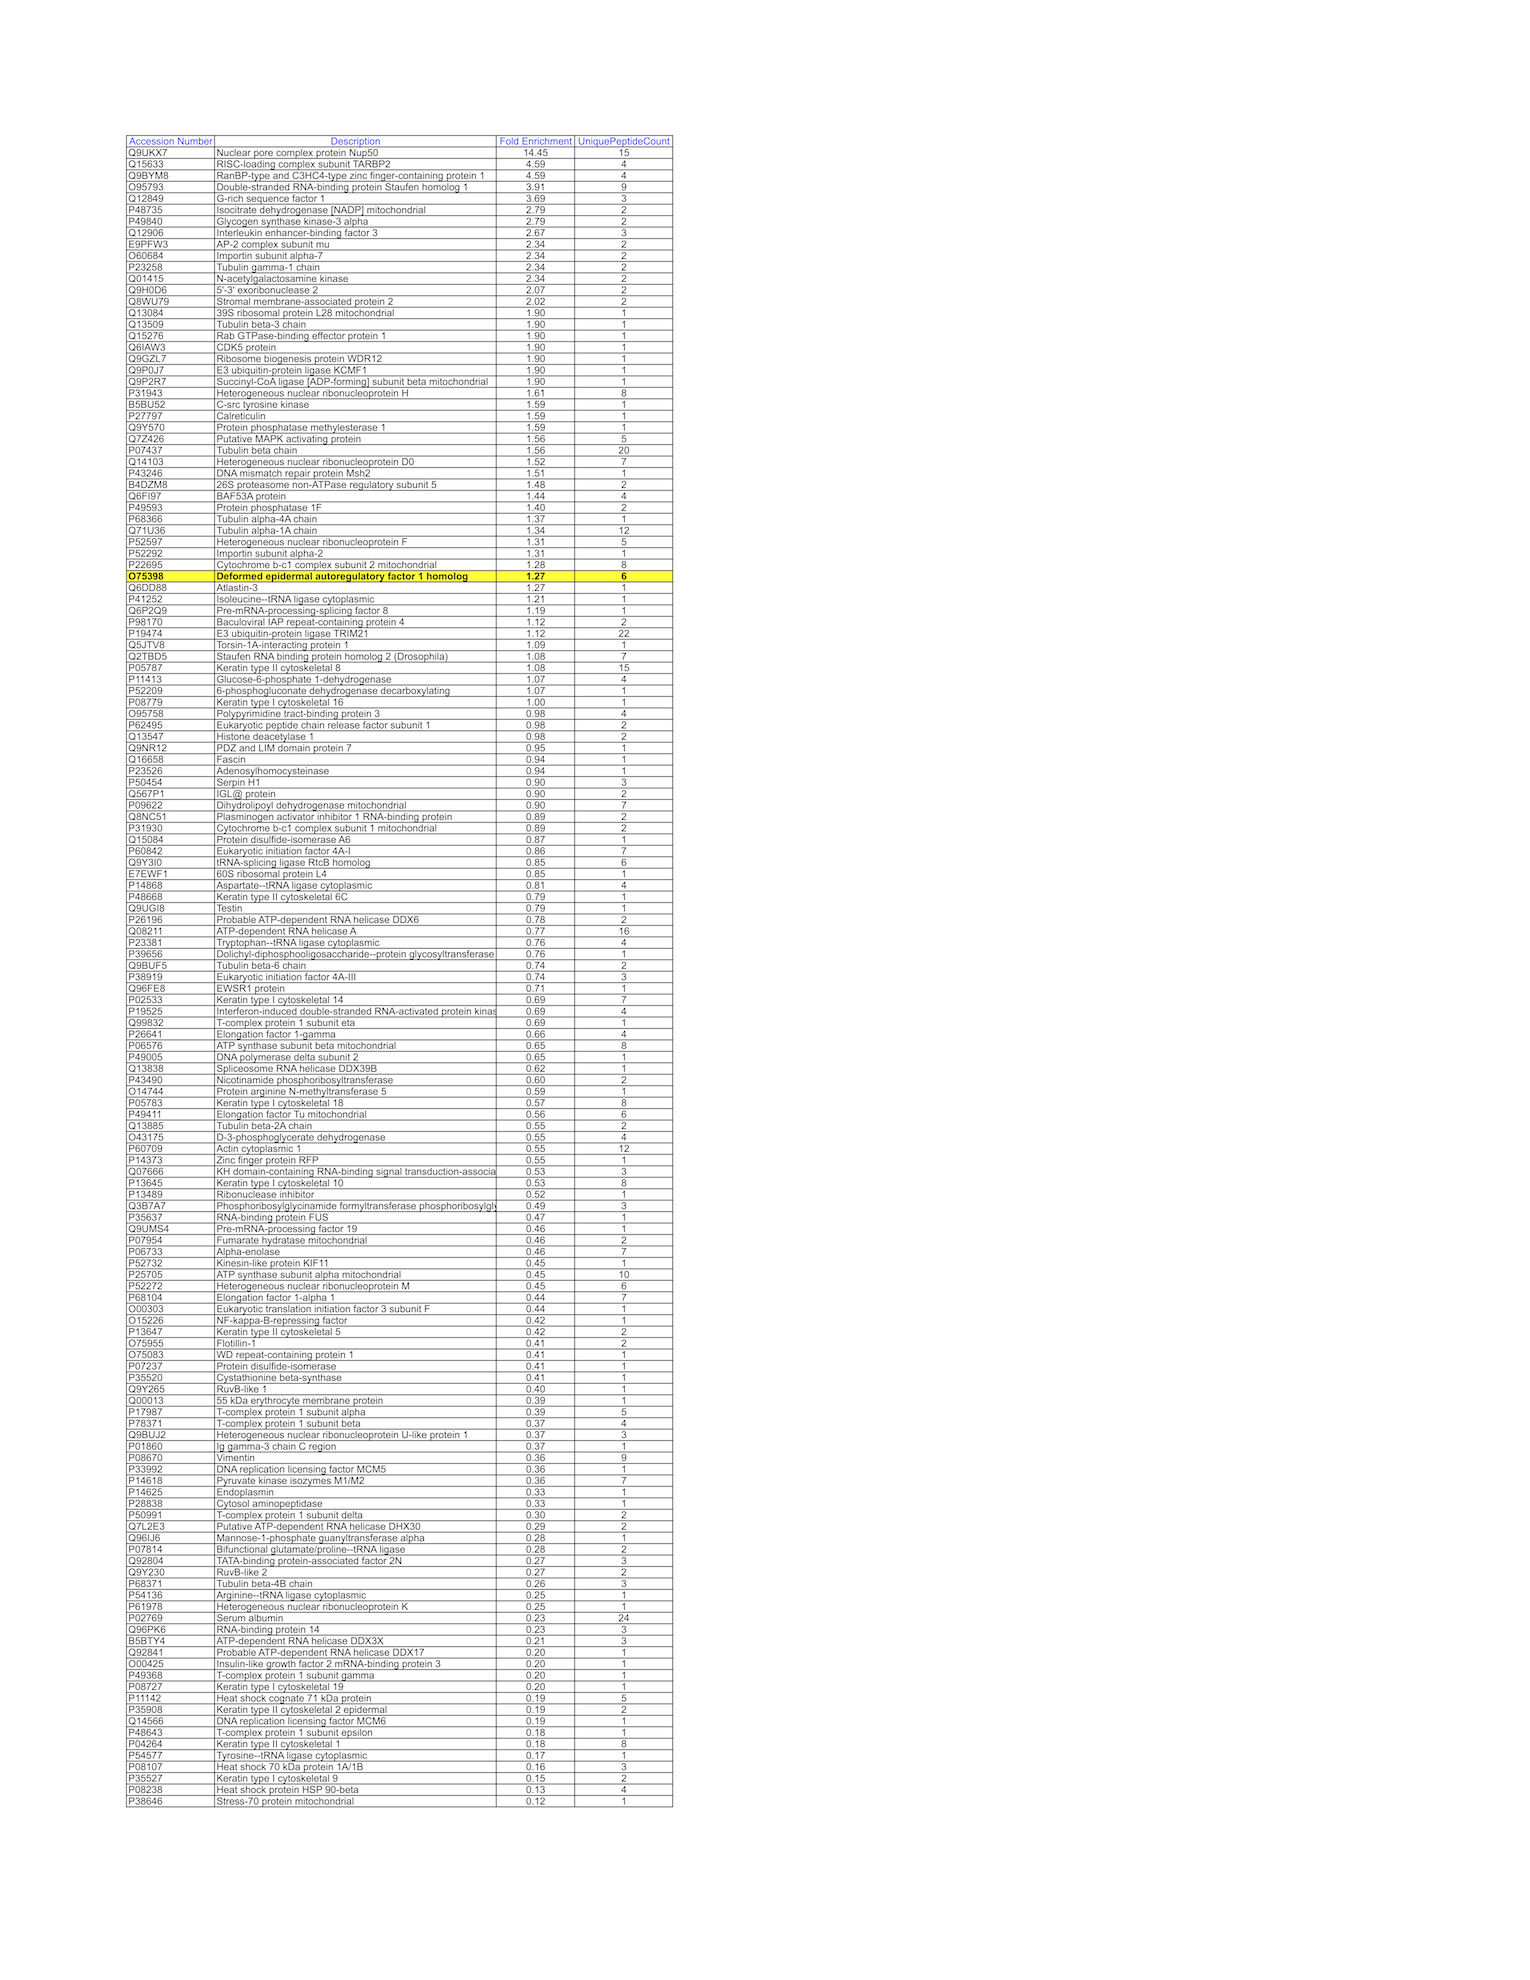
- Caption
- K562 whole cell lysate was immunoprecipitated using the primary antibody (GeneTex; GTX115430). The IP fraction was loaded on a 12% Bio-Rad TGX gel and separated with the Bio-Rad Tetra Cell system. A gel fragment (rectangle outline) corresponding to the band indicated on the Coomassie Blue stained gel image was excised and sent to the University of Alabama at Birmingham Cancer Center Mass Spectrometry/Proteomics Shared Facility. Analysis of gel fragment 1 from K562: The sample was analyzed on a LTQ XL Linear Ion Trap Mass Spectrometer by LC-ESI-MS/MS. Peptides were identified using SEQUEST tandem mass spectral analysis with probability based matching at p < 0.05. SEQUEST results were reported with ProteinProphet protXML Viewer (TPP v4.4 JETSTREAM) and filtered for a minimum probability of 0.9. All protein hits that met these criteria were reported, including common contaminants. Fold enrichment for each protein reported was determined using a custom script based on the FC-B score calculation from the reference Mellacheruvu et al., 2013. The CRAPome: a contaminant repository for affinity purification mass spectrometry data. Nat. Methods. 10(8):730-736. Doi:10.1038/nmeth.2557. The target protein, DEAF1, was identified as the 38th enriched protein and the 1st transcription factor based on IP-Mass Spectrometry.
- Submitter comment
- --
- Reviewer comment
- Not within top 20 factors ranked by fold enrichment
- Submitted by
- Mark Mackiewicz
- Lab
- Richard Myers, HAIB
- Grant
- U54HG006998
- Download
- DEAF1-1.png
DEAF1 (Homo sapiens)
Method: immunoprecipitation followed by mass spectrometry
compliant
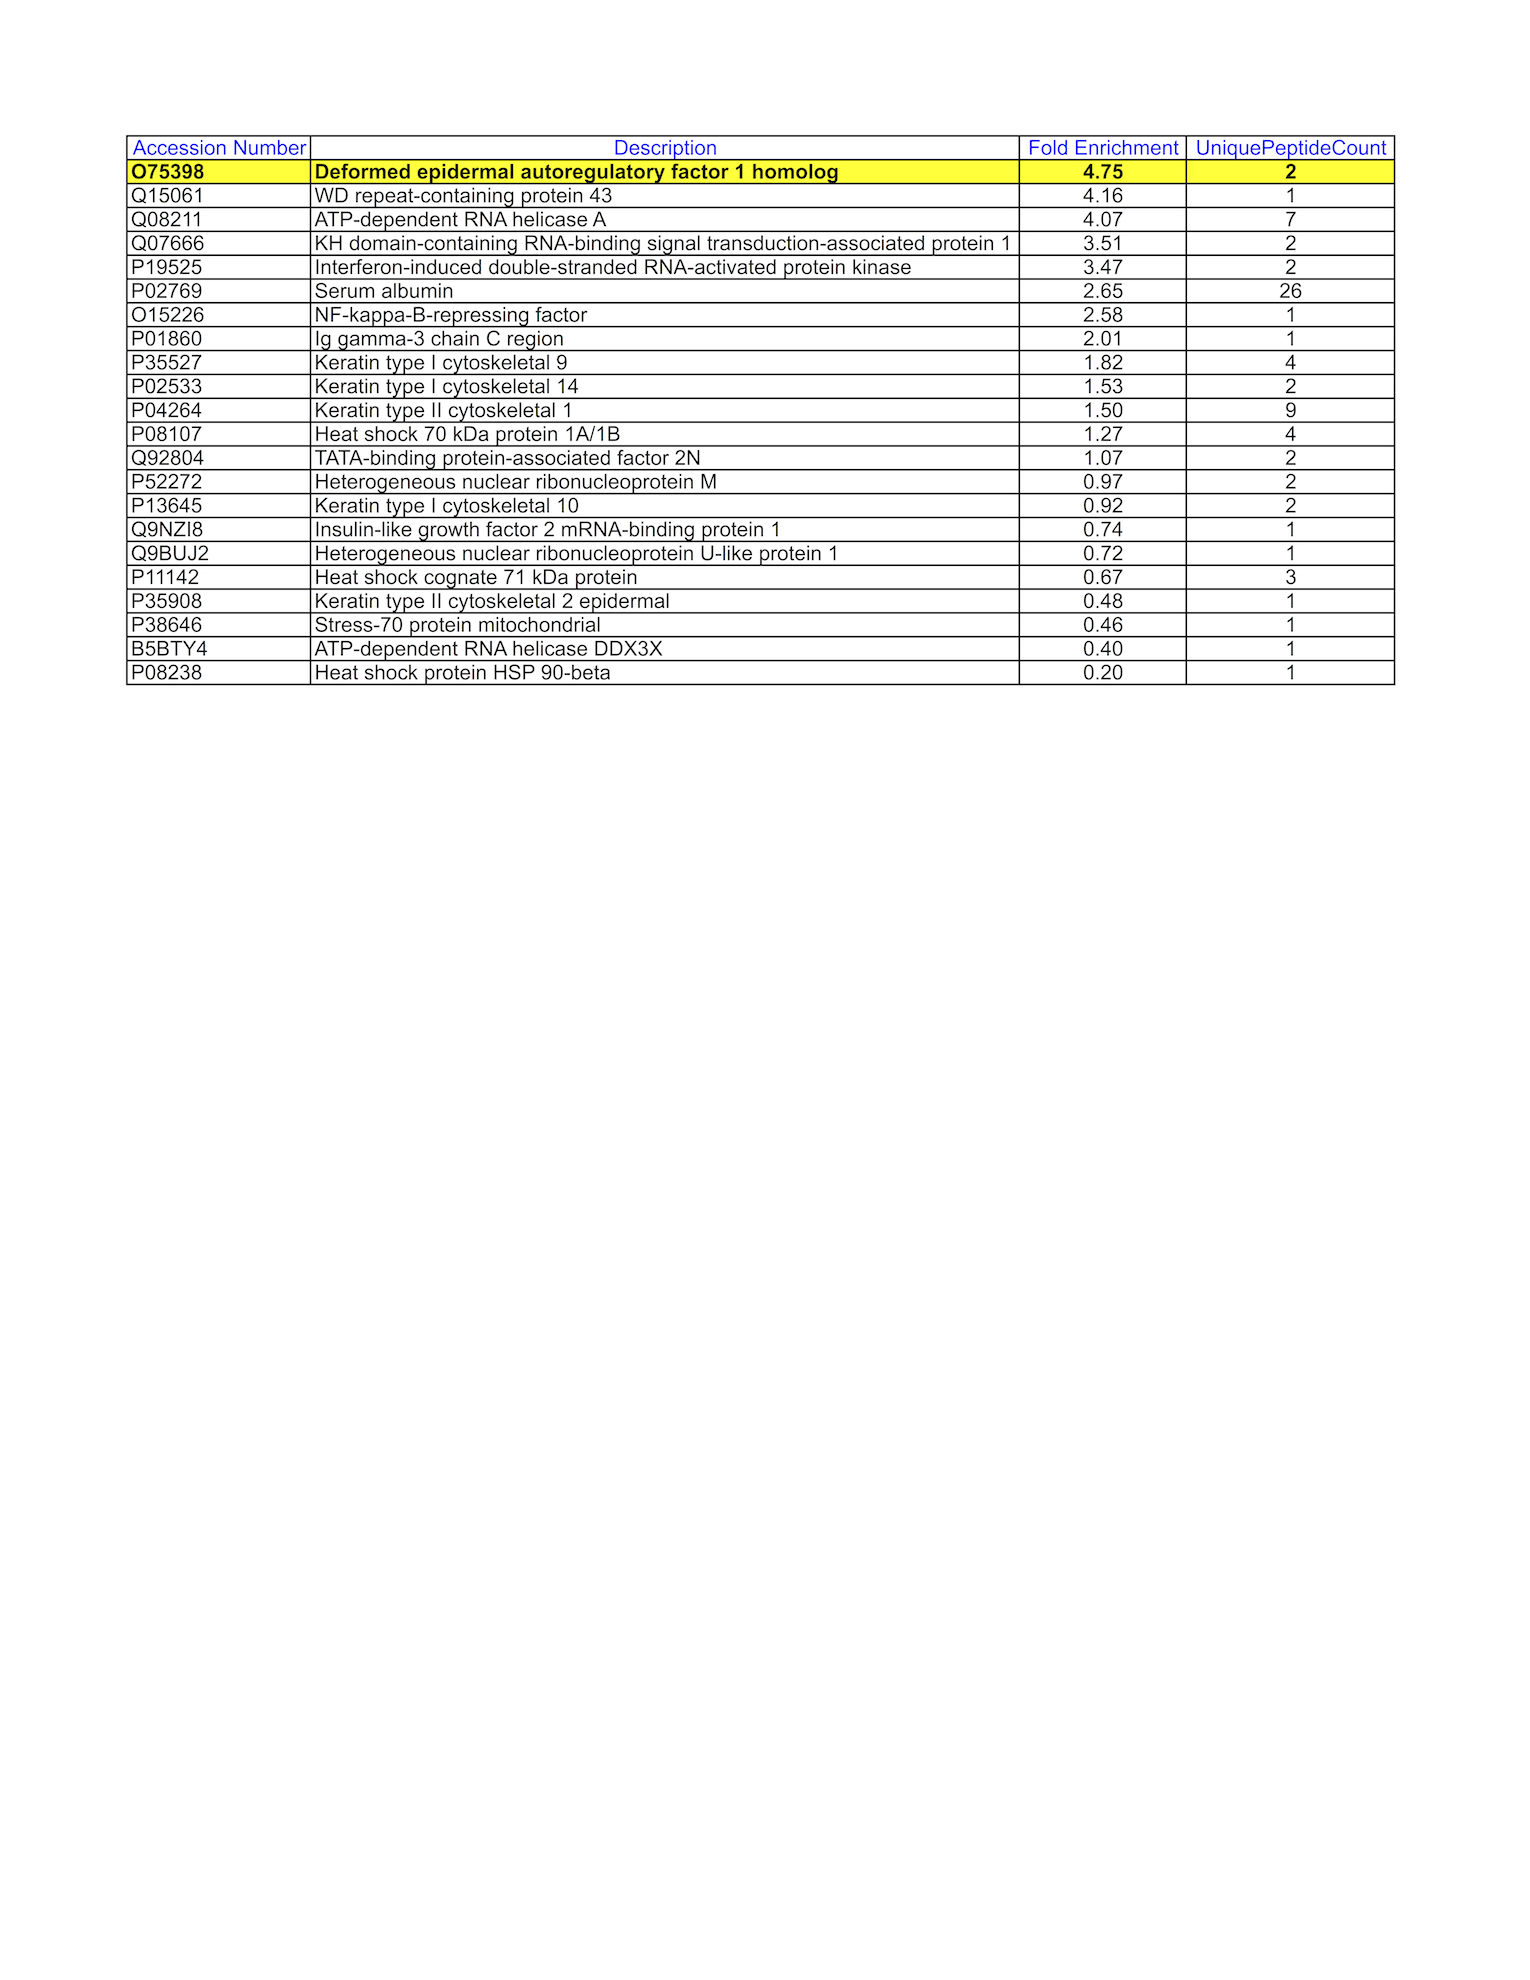
- Caption
- K562 whole cell lysate was immunoprecipitated using the primary antibody (GeneTex; GTX115430). The IP fraction was loaded on a 12% Bio-Rad TGX gel and separated with the Bio-Rad Tetra Cell system. A gel fragment (rectangle outline) corresponding to the band indicated on the Coomassie Blue stained gel image was excised and sent to the University of Alabama at Birmingham Cancer Center Mass Spectrometry/Proteomics Shared Facility. Analysis of gel fragment 2 from K562: The sample was analyzed on a LTQ XL Linear Ion Trap Mass Spectrometer by LC-ESI-MS/MS. Peptides were identified using SEQUEST tandem mass spectral analysis with probability based matching at p < 0.05. SEQUEST results were reported with ProteinProphet protXML Viewer (TPP v4.4 JETSTREAM) and filtered for a minimum probability of 0.9. All protein hits that met these criteria were reported, including common contaminants. Fold enrichment for each protein reported was determined using a custom script based on the FC-B score calculation from the reference Mellacheruvu et al., 2013. The CRAPome: a contaminant repository for affinity purification mass spectrometry data. Nat. Methods. 10(8):730-736. Doi:10.1038/nmeth.2557. The target protein, DEAF1, was identified as the 1st enriched protein and the 1st transcription factor based on IP-Mass Spectrometry.
- Submitter comment
- --
- Submitted by
- Mark Mackiewicz
- Lab
- Richard Myers, HAIB
- Grant
- U54HG006998
- Download
- DEAF1-2.png
DEAF1 (Homo sapiens)
K562
Method: immunoprecipitation
not submitted for review by lab
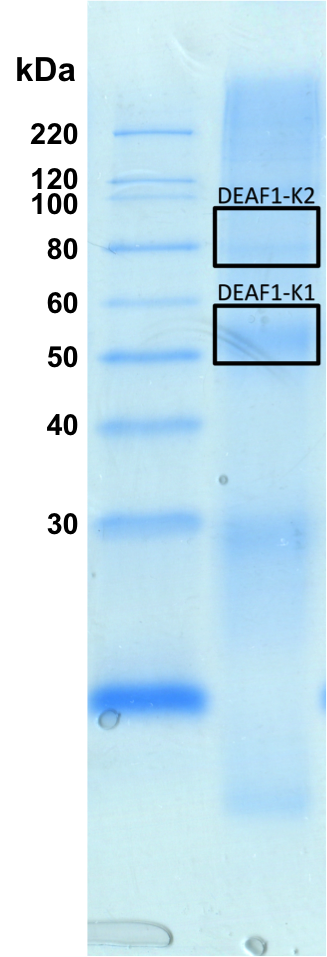
- Reviewer comment
- IP gel for mass spectrometry analysis
- Submitted by
- Mark Mackiewicz
- Lab
- Richard Myers, HAIB
- Grant
- U54HG006998
- Download
- DEAF1_IP-Commassie1.png
DEAF1 (Homo sapiens)
K562HepG2
Method: immunoprecipitation
exempt from standards
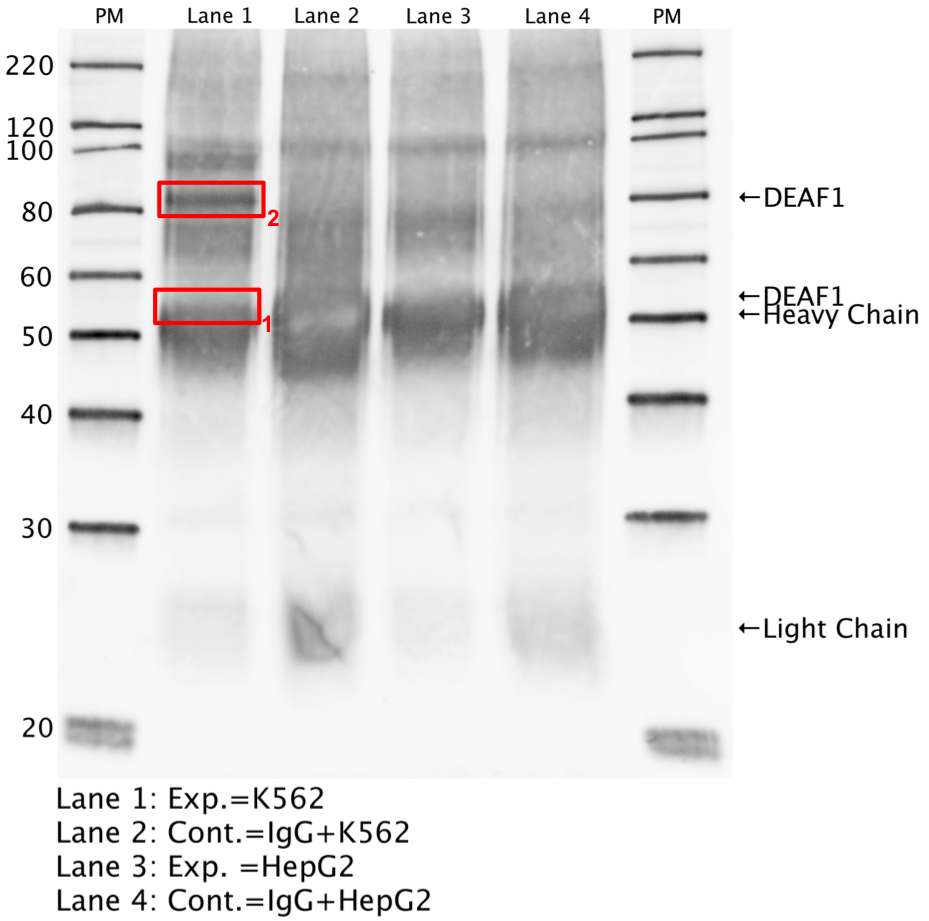
- Caption
- Whole cell lysates of K562 and HepG2 were immunoprecipitated using the primary antibody (GeneTex; GTX115430). The IP fraction was separated on a 12% acrylamide gel with the Bio-Rad PROTEAN II xi system. After separation, the samples were transferred to a nitrocellulose membrane with an Invitrogen iBlot system. The membrane was probed with the primary antibody (same as that used for IP) and a secondary HRP-conjugated antibody. The resulting bands were visualized with SuperSignal West Femto Solution (Thermo Scientific). Protein Marker (PM) is labeled in kDa. Two bands were detected at ~55 and 82 kDa. Expected size ~58-59 kDa.
- Submitter comment
- --
- Reviewer comment
- Band not 50% of signal and shared by IgG control
- Submitted by
- Mark Mackiewicz
- Lab
- Richard Myers, HAIB
- Grant
- U54HG006998
- Download
- DEAF1_IP-WB.png