ENCAB000AEC
Antibody against Homo sapiens SMARCC2
Homo sapiens
at least one cell type or tissue
awaiting characterization
- Status
- released
- Source (vendor)
- Santa Cruz Biotech
- Product ID
- sc-10757
- Lot ID
- E0204
- Characterized targets
- SMARCC2 (Homo sapiens)
- Host
- rabbit
- Clonality
- polyclonal
- Antigen description
- BAF170 (H-116) is Raised against amino acids 1093-1208 of BAF170 of human origin.
- External resources
Characterizations
SMARCC2 (Homo sapiens)
not reviewed
- Caption
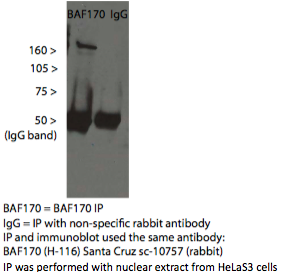
- A single band consistent with the commonly observed mobility of BAF170/SMARCC2 (~170kD) is immunoprecipitated from HeLaS3 nuclear lysate using sc-10757. Mass spectrometry confirms that this band contains BAF170 in high abundance (see validation #2).
- Submitted by
- Michael Snyder
- Lab
- Michael Snyder, Stanford
- Grant
- U54HG004558
SMARCC2 (Homo sapiens)
Method: immunoprecipitation followed by mass spectrometry
not reviewed
- Caption
- Methodology HeLaS3 whole cell lysates were immunoprecipitated using sc10757, and the IP fraction was loaded on a 10% polyacrylamide gel (NuPAGE Bis-Tris Gel) and separated with an invitrogen NuPAGE electrophoresis system. The gel was silver-stained, gel fragments corresponding to the bands indicated were excised and destained using the SilverSNAP Stain for Mass Spectrometry (Pierce). Then proteins were trypsinized using the in-gel digestion method. The samples were subjected to nanoflow chromatography using the nanoAcquity UPLC system (Waters Inc.) prior to introduction into the mass spectrometer for further analysis. Mass spectrometry was performed on a hybrid ion trap LTQ Orbitrap mass spectrometer (Thermo Fisher Scientific) in positive electrospray ionization (ESI) mode. The spectra was acquired in a data dependent fashion consisting of full mass spectrum scan (300-2000 m/z) followed by MS/MS scan of the 3 most abundant parent ions. For the full scan in the orbitrap the automatic gain control (AGC) was set to 16106 and the resolving power for 400 m/z of 30,000. The MS/MS scans were done using the ion trap part of the mass spectrometer at a normalized collision energy of 24 V. Dynamic exclusion time was set to 100 s to avoid loss of MS/MS spectral information due to repeated sampling of the most abundant peaks. Sequence data from MS/MS spectra was processed using the SEQUEST database search algorithm (Thermo Fisher Scientific). The resulting protein identifications were brought into the Scaffold visualization software (Proteome Software) where the information was further refined resulting in improved protein id conformation. Scaffold search criteria were set at 98% probability and required at least 2 unique peptides per id. HeLaS3 whole cell lysates were immunoprecipitated using sc10757, and the IP fraction was loaded on a 10% polyacrylamide gel (NuPAGE Bis-Tris Gel) and separated with an invitrogen NuPAGE electrophoresis system. The gel was silver-stained, gel fragments corresponding to the bands indicated were excised and destained using the SilverSNAP Stain for Mass Spectrometry (Pierce). Then proteins were trypsinized using the in-gel digestion method. The samples were subjected to nanoflow chromatography using the nanoAcquity UPLC system (Waters Inc.) prior to introduction into the mass spectrometer for further analysis. Mass spectrometry was performed on a hybrid ion trap LTQ Orbitrap mass spectrometer (Thermo Fisher Scientific) in positive electrospray ionization (ESI) mode. The spectra was acquired in a data dependent fashion consisting of full mass spectrum scan (300-2000 m/z) followed by MS/MS scan of the 3 most abundant parent ions. For the full scan in the orbitrap the automatic gain control (AGC) was set to 16106 and the resolving power for 400 m/z of 30,000. The MS/MS scans were done using the ion trap part of the mass spectrometer at a normalized collision energy of 24 V. Dynamic exclusion time was set to 100 s to avoid loss of MS/MS spectral information due to repeated sampling of the most abundant peaks. Sequence data from MS/MS spectra was processed using the SEQUEST database search algorithm (Thermo Fisher Scientific). The resulting protein identifications were brought into the Scaffold visualization software (Proteome Software) where the information was further refined resulting in improved protein id conformation. Scaffold search criteria were set at 98% probability and required at least 2 unique peptides per id.
- Submitted by
- Michael Snyder
- Lab
- Michael Snyder, Stanford
- Grant
- U54HG004558
